 The MIRASTACK Platform
The sovereign, AI-native platform that unifies technology observability and business analytics. Run entirely on your infrastructure — on-premises or air-gapped — to consolidate your monitoring and BI tools into a single, governed control plane.
One Platform for Technology and Business Signals
Traditional monitoring vendors optimize for a single dimension — metrics, logs, or traces — and treat business data as somebody else's problem. Business-intelligence vendors do the inverse, remaining blind to the systems that generate the revenue. MIRASTACK collapses that divide into a single, self-hosted platform where operational telemetry and business data live side by side.
Unifying the Operational and Commercial Divide
MIRASTACK is engineered as the consolidation point. It connects to purpose-built observability stores and to SQL-warehouse-class business backends through the same integration model, renders both through a single visual experience, and lets an AI assistant investigate across every signal without the analyst ever writing a query.
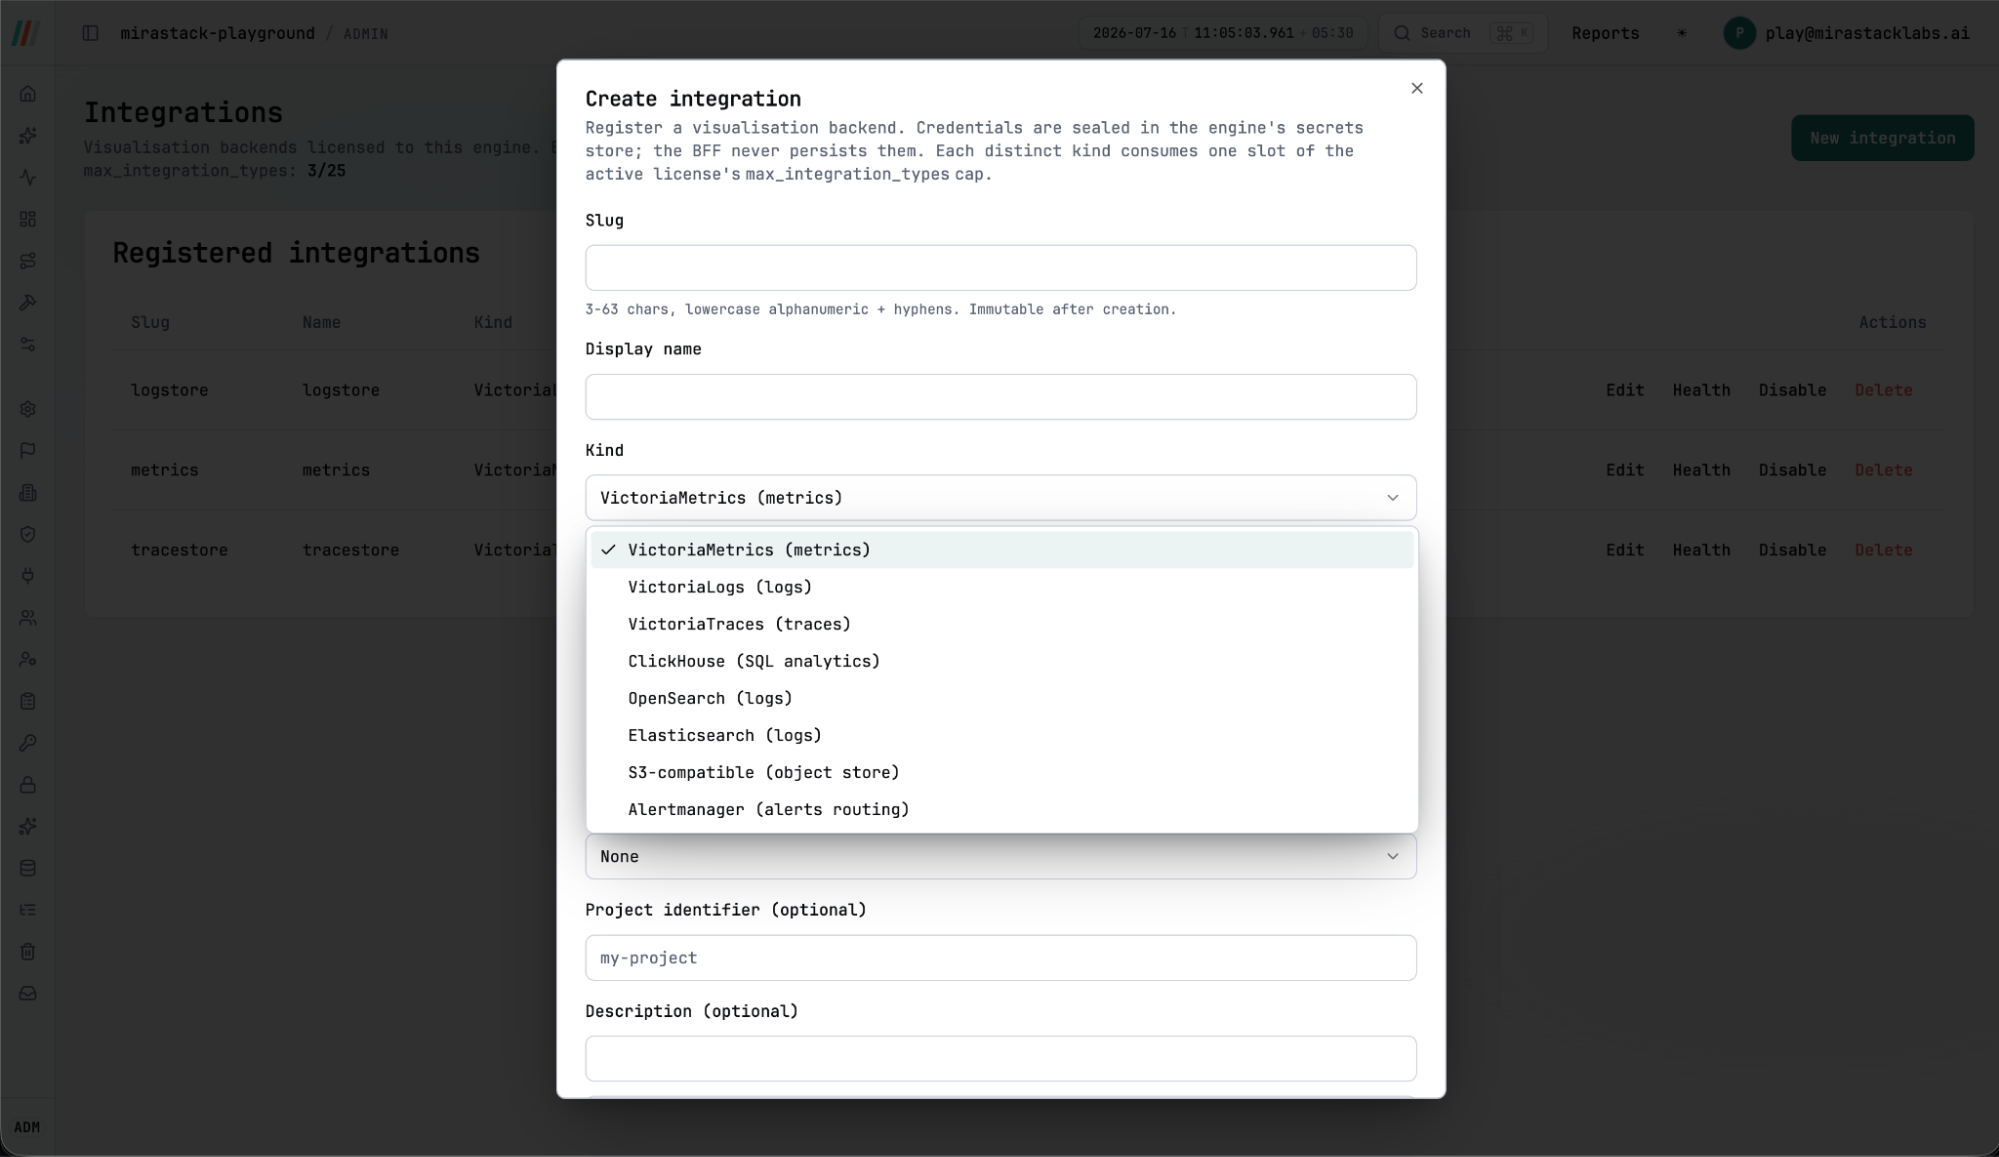
- Open Data Foundation: Standardized on VictoriaMetrics, VictoriaLogs, and VictoriaTraces for telemetry, with ClickHouse, OpenSearch, and S3 for analytical workloads.
- Autonomous Intelligence (MIRA): Investigation, root-cause analysis, correlation, prediction, and SLO reasoning accessible in natural language.
- Generative UI: Bring your own model on-premises (Ollama, vLLM) or use commercial APIs; results render as interactive React components.
The Architecture of Sovereignty
Four tightly integrated pillars define the MIRASTACK Platform, enabling high-performance telemetry collection, no-code visualization, agentic AI reasoning, and a hardened alerting plane.
Pillar 1: Unified Data Platform & BI Consolidation
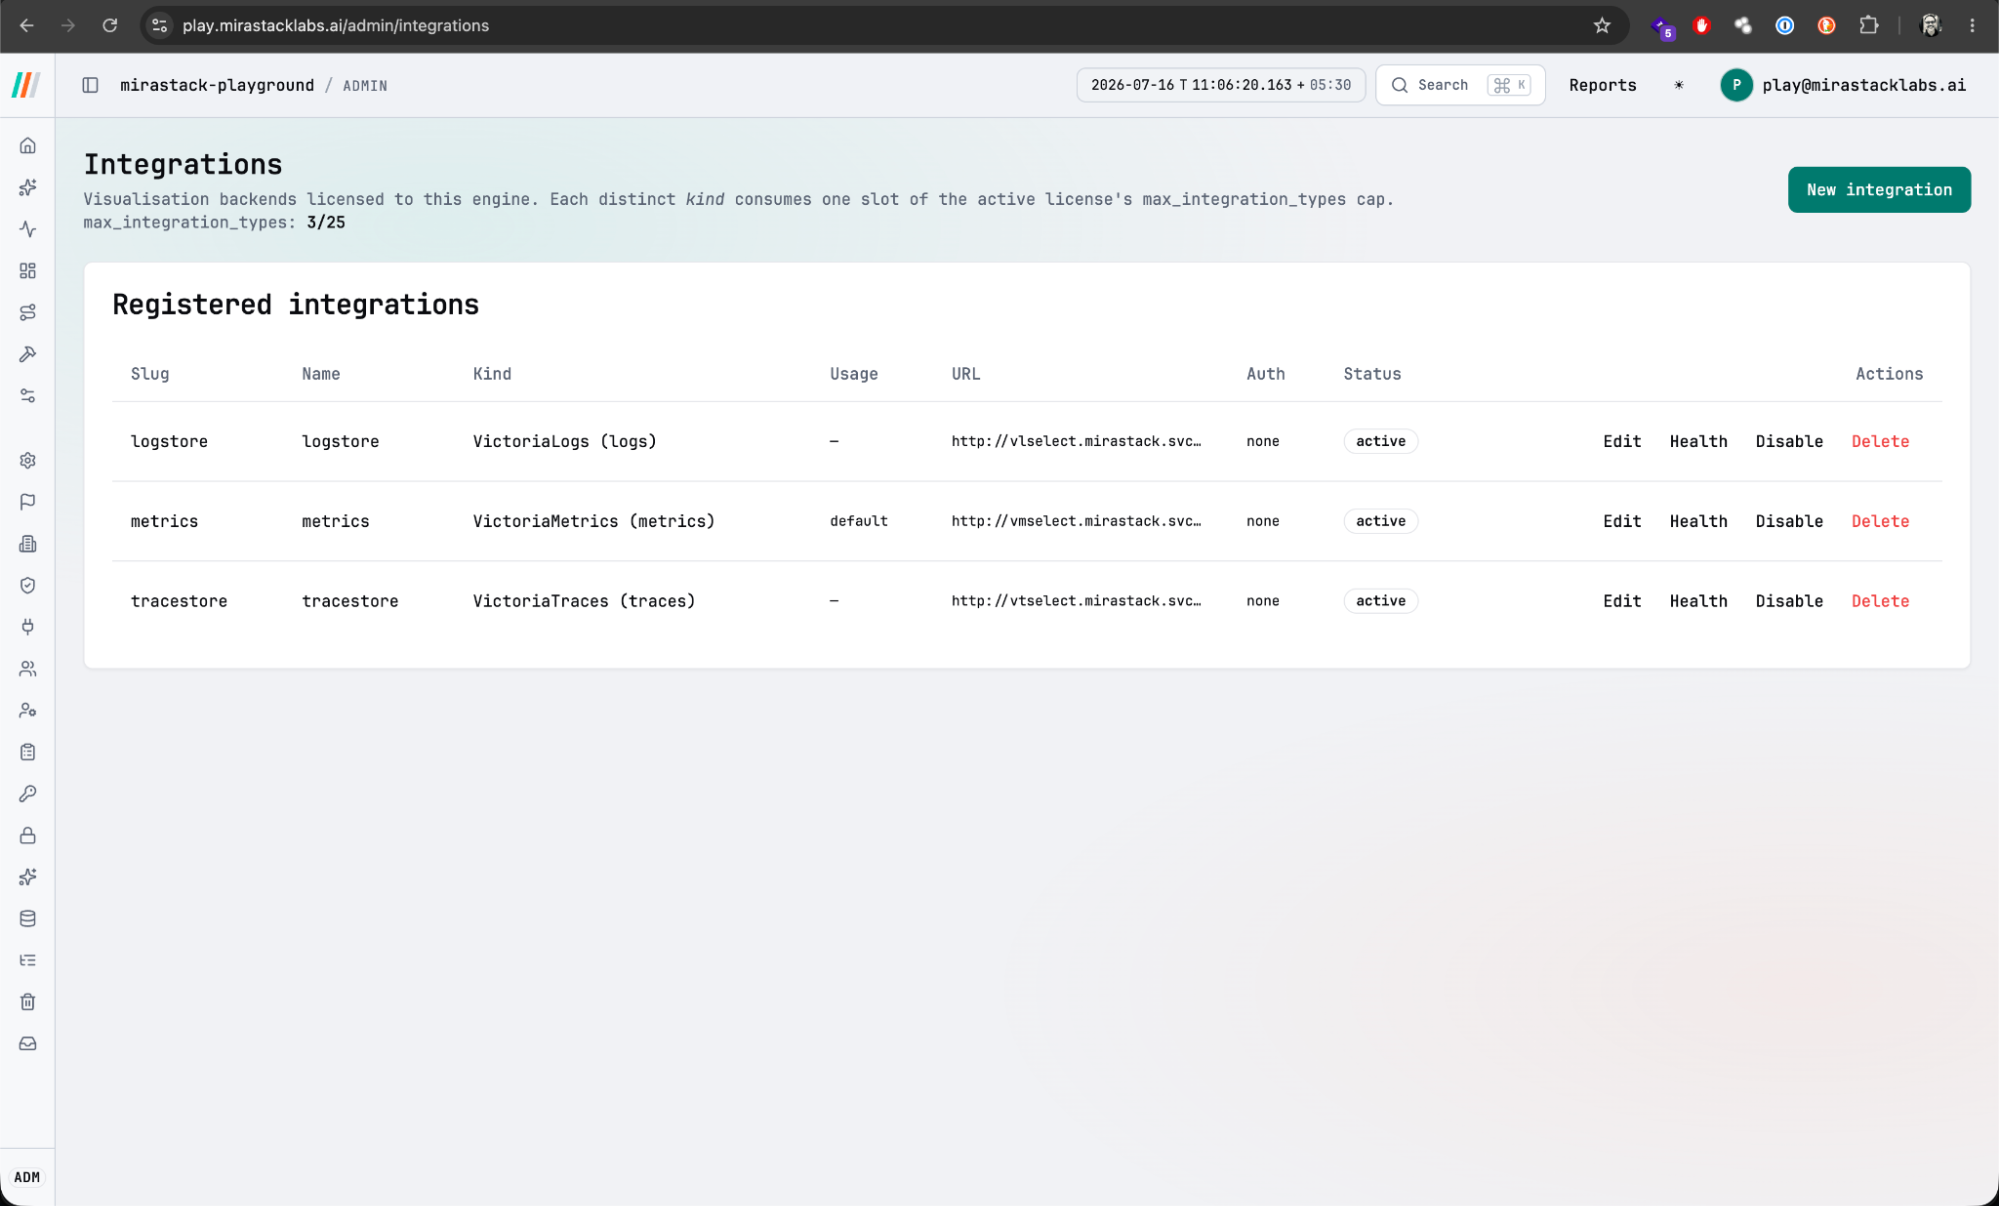
A data source is a first-class, pluggable concept rather than a hard-wired assumption. Connect many data sources centrally and combine technical and business signals on a single canvas, positioning MIRASTACK as a direct consolidation path for standalone BI tools.
- Per-widget source binding: metrics, logs, traces, and SQL co-exist
- Sovereign by construction: no data round-trip to a vendor cloud
- Cost-efficient storage: VictoriaMetrics compresses metrics 10–20× better than alternatives
Pillar 2: Data Studio No-Code Composer
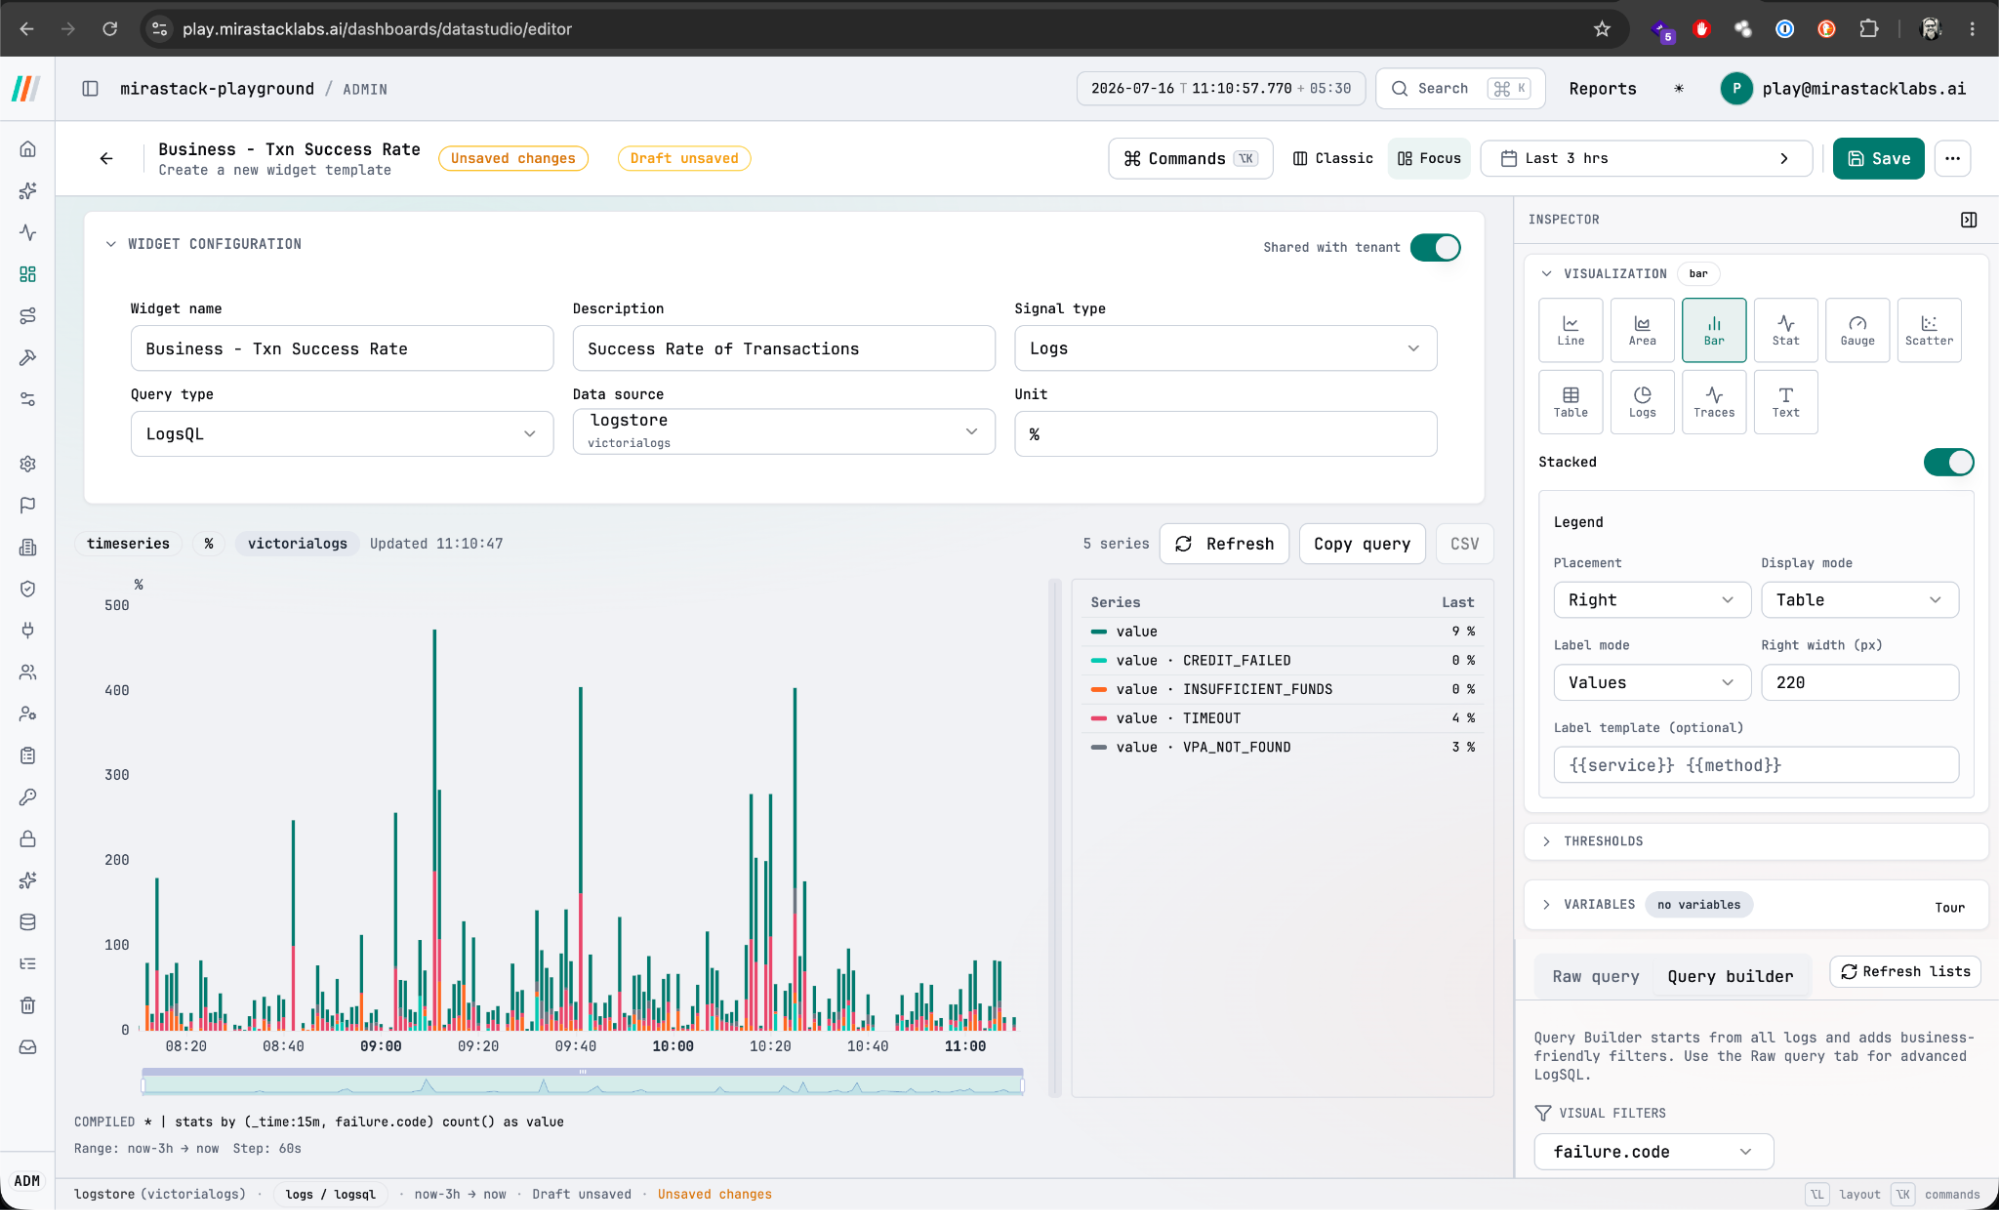
The operator-facing composer that sits upstream of everything visual in MIRASTACK. Deliberately designed so that the learning curve is flat: an analyst who understands the question can build the visual without first learning a query language.
- No-code visual builders for metrics, logs, traces, and ClickHouse SQL
- Ten visualization types: time series, bar, single-value, tables, log views, and more
- Live preview, autosaved drafts, and guided onboarding tours
Pillar 3: MIRA Agentic Intelligence (EGA-Governed)
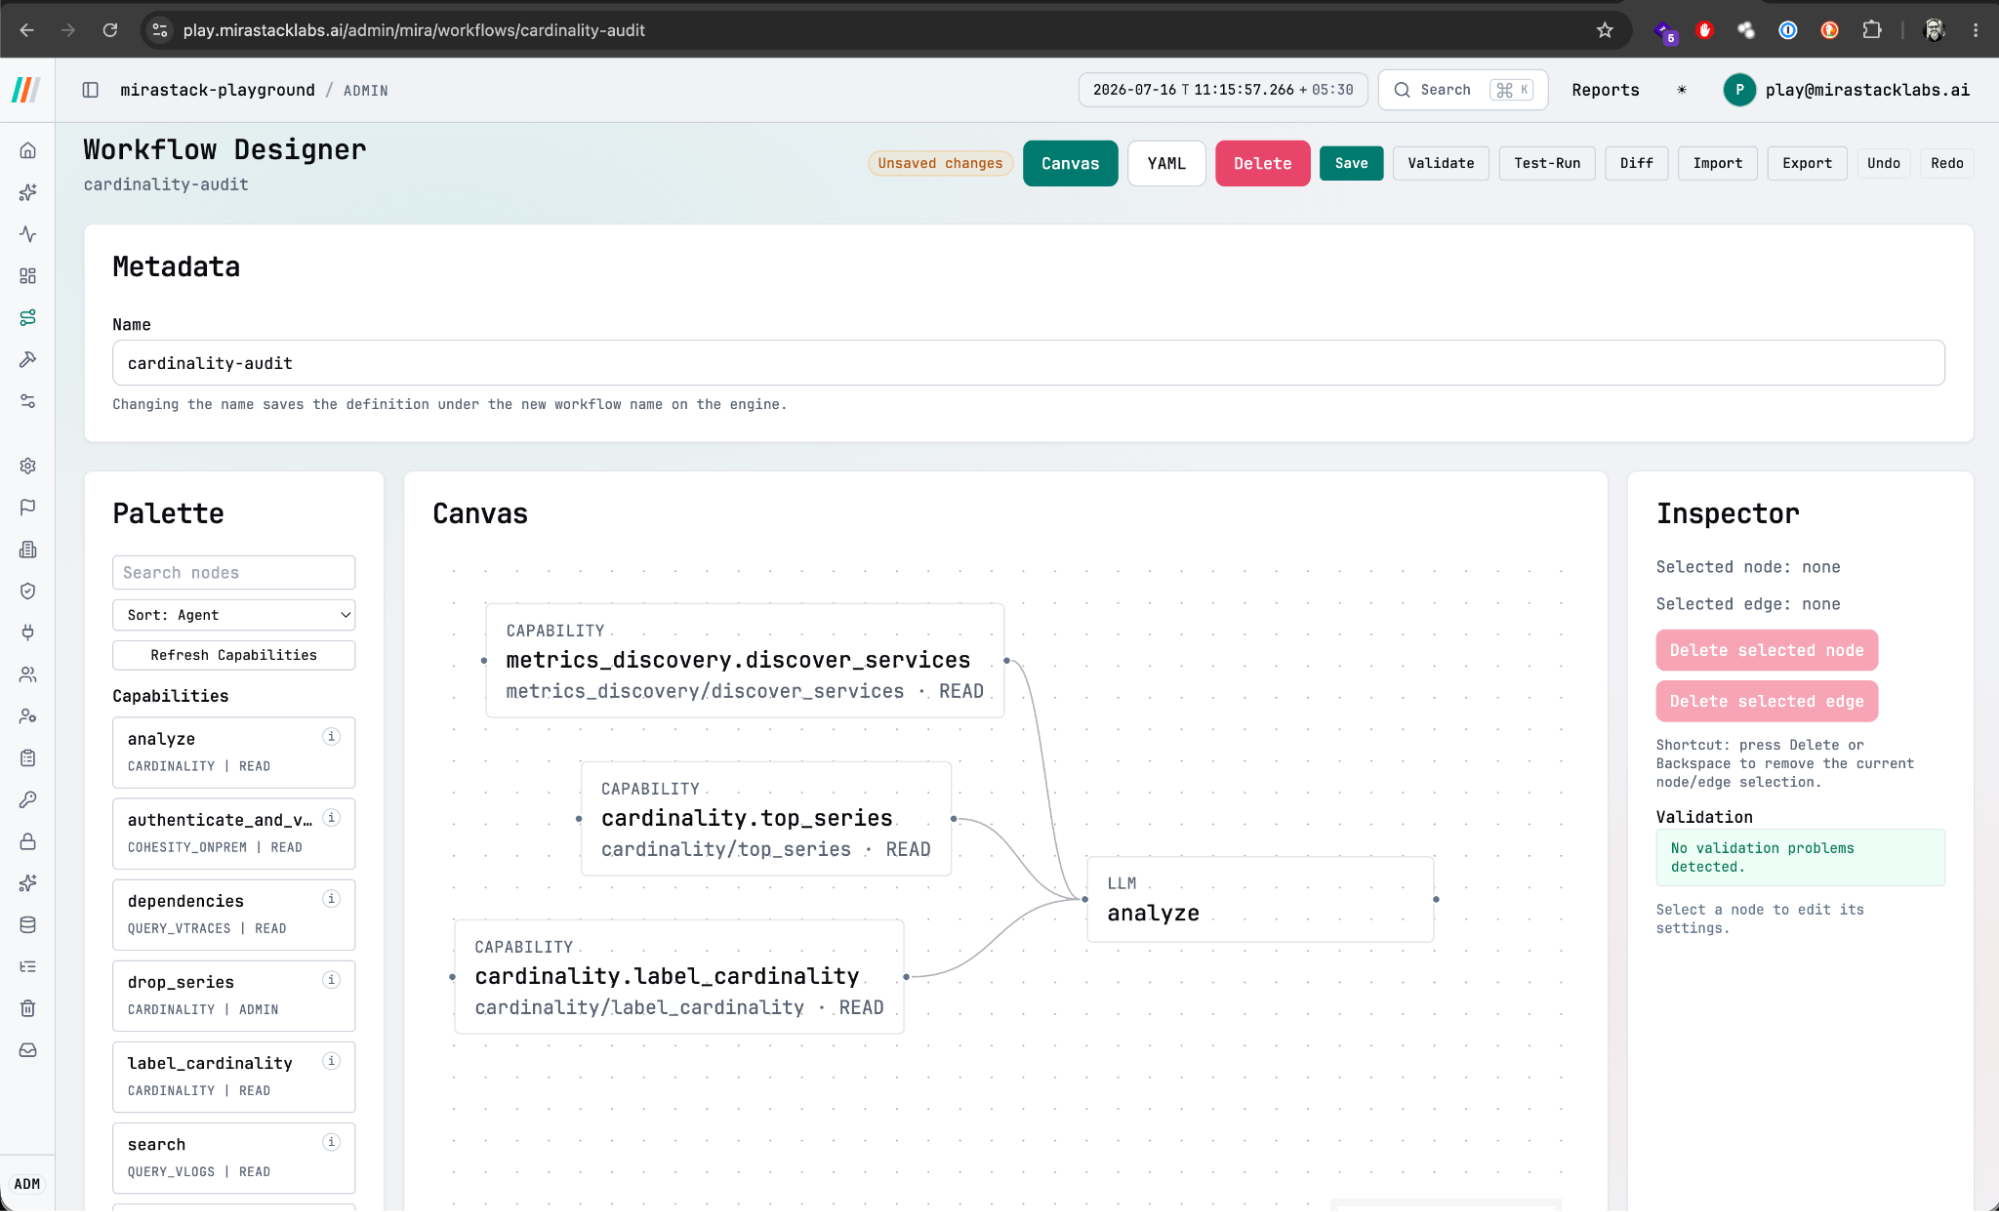
Every observability query is accessible through natural language via MIRA. Powered by EGAProtocol, MIRA acts as a governed agentic plane that orchestrates specialized agents under strict wire-level security rules.
- EGAProtocol Core: Authoring the open standard for wire-level 5AG agent governance
- Three Execution Lanes: Pre-defined (Lane 1), Autonomous DAG (Lane 2), and AI-Improvised (Lane 3)
- Generative UI: 18 component kinds streamed in real-time (charts, tables, DAGs, traces)
Pillar 4: Alerting & Operate Control Plane
A complete alerting and on-call control plane built on a hardened fork of Prometheus Alertmanager v0.32.x. Alerting configurations are governed, versioned, and testable as application code.
- Multi-tenancy: each tenant owns its own alertmanager configuration
- Sealed secrets: AES-256-GCM encrypted receiver credentials
- Operate Portal: live stream, escalation policies, rotations, and SLO management
Observe Portal: Your Observability Nerve Center
The Observe portal is the comprehensive observability experience, built on the three VictoriaStack data stores. It ships with 1,200+ pre-built dashboard widgets, 15+ native integrations, and full parity with legacy observability UIs.
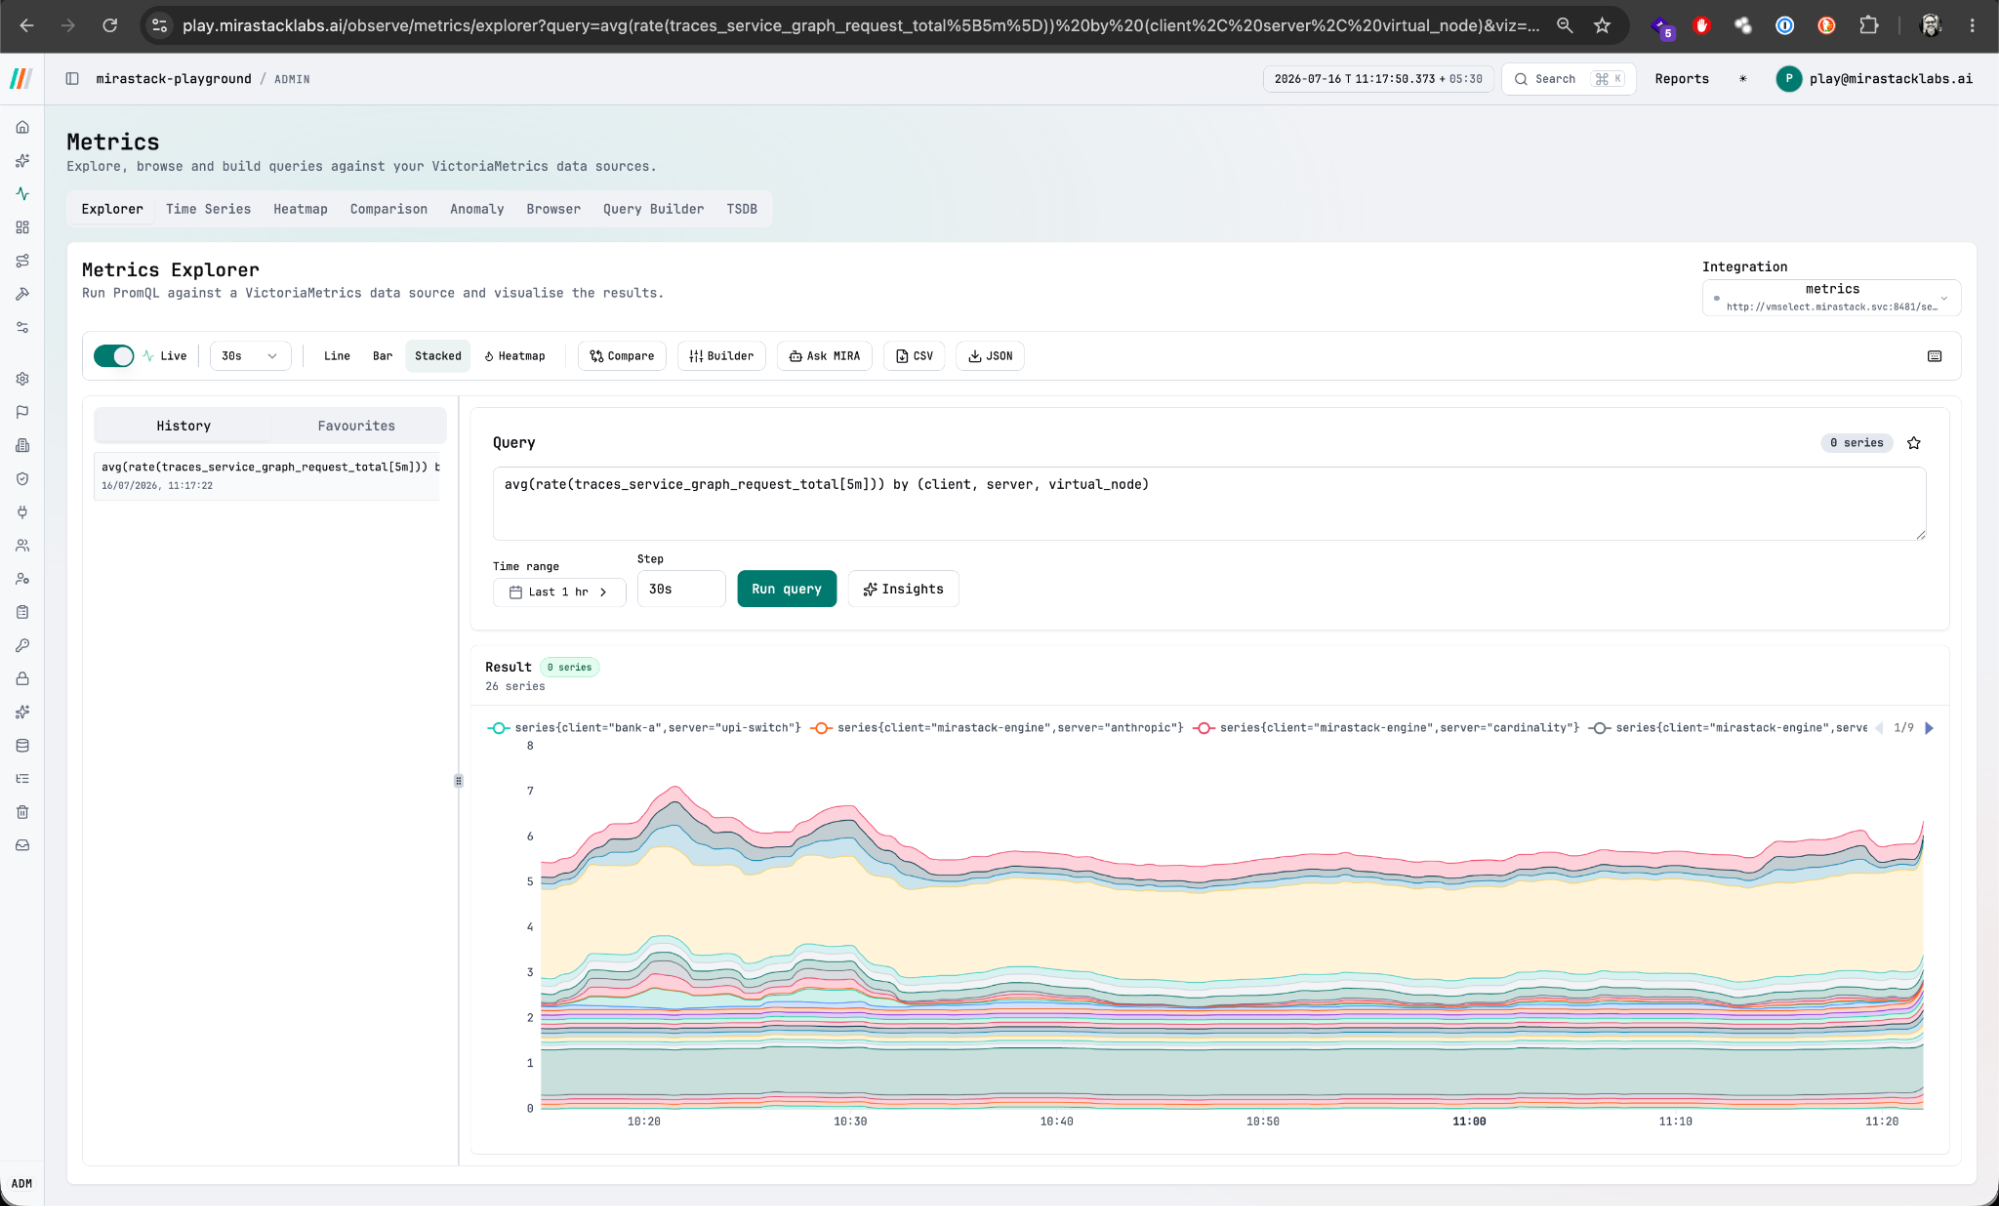
Metrics Exploration
Query PromQL/MetricsQL with syntax highlighting, live autocomplete, and instant results. Visualize multi-series ECharts with thresholds, confidence bands, and anomaly detection.
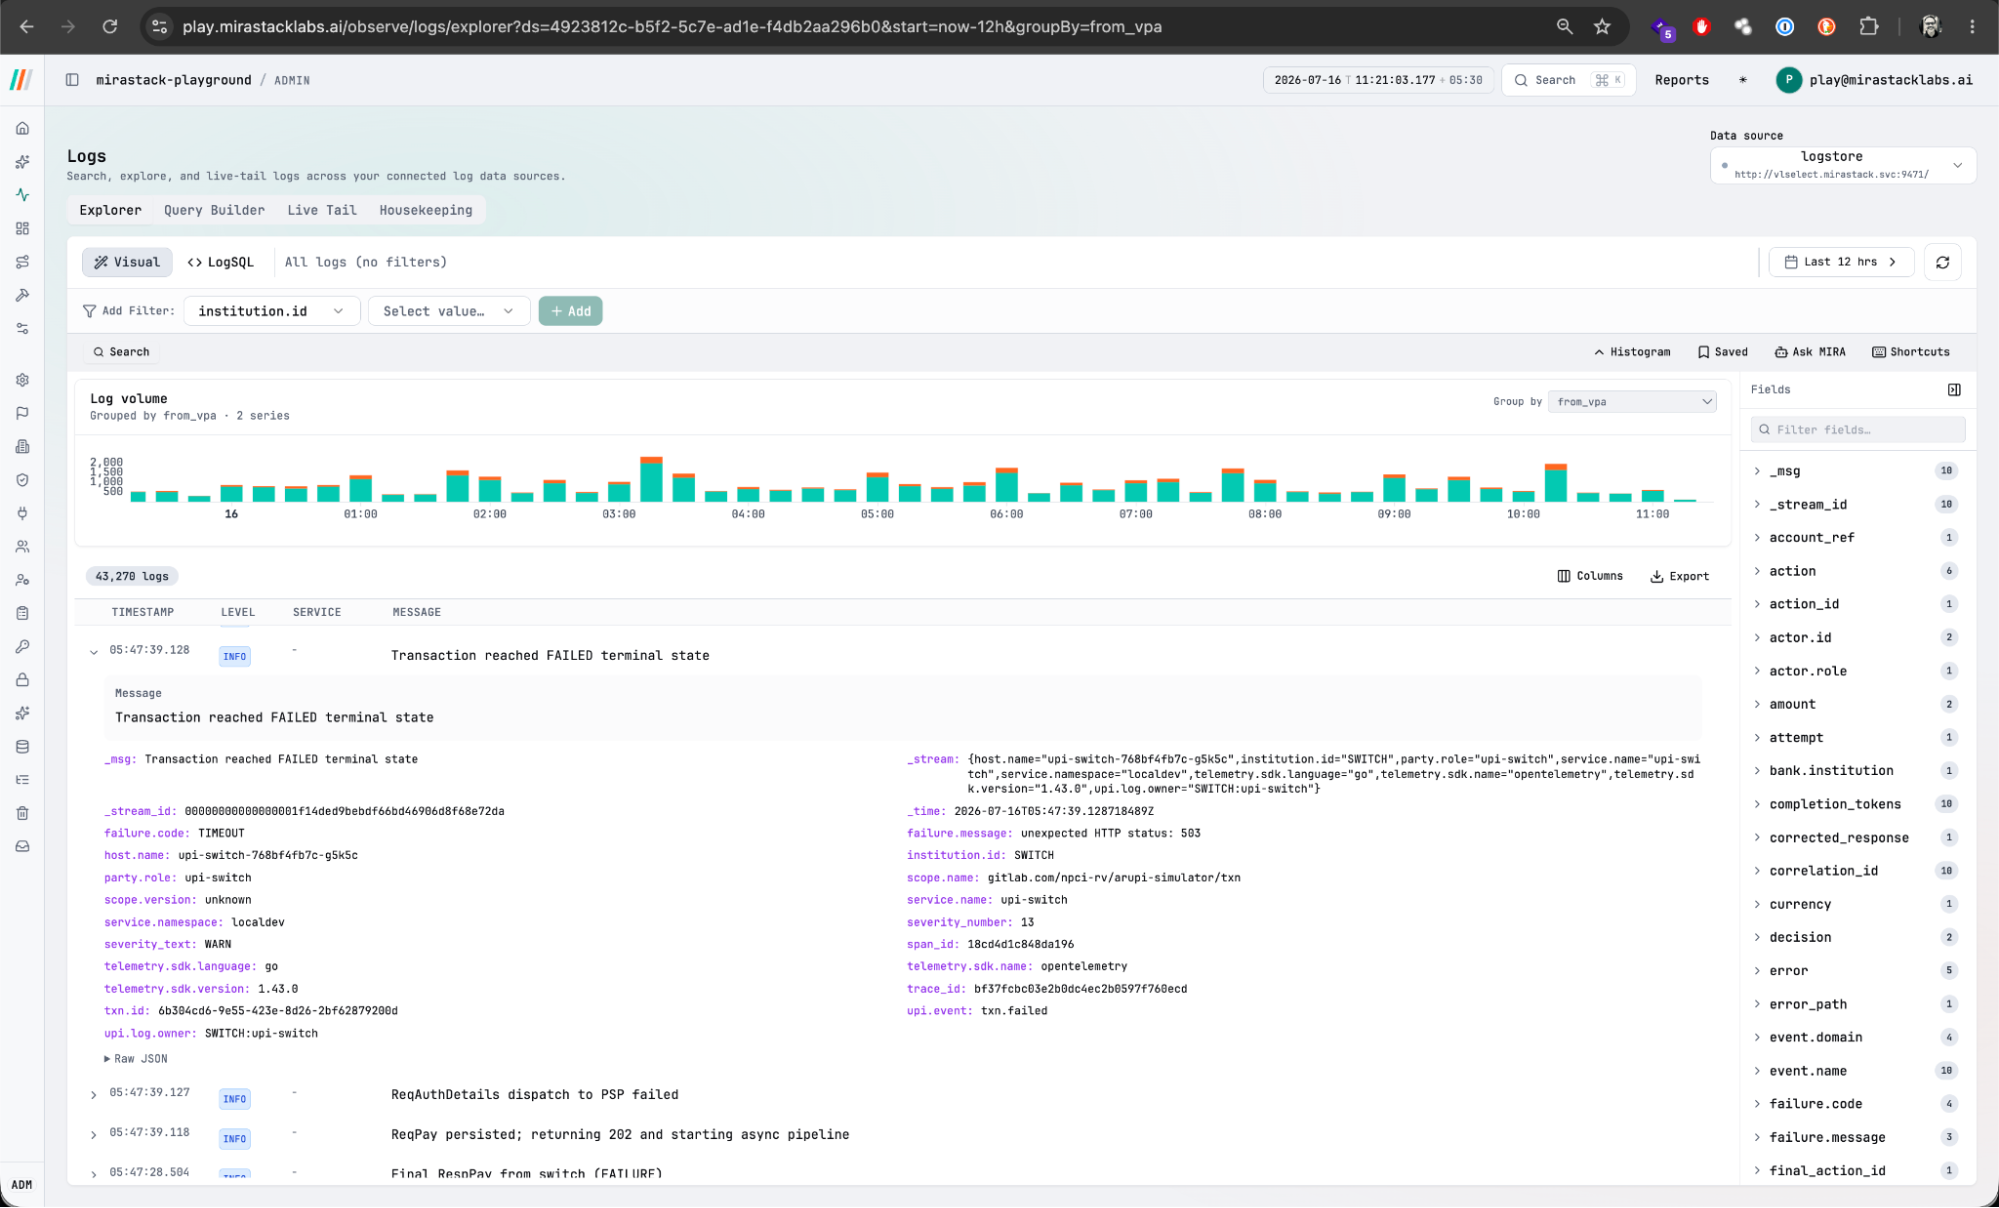
Logs Exploration
LogSQL query builder with stream filters, field faceting, and regex search. Stream logs in real-time with filters and view time-bucket distributions.
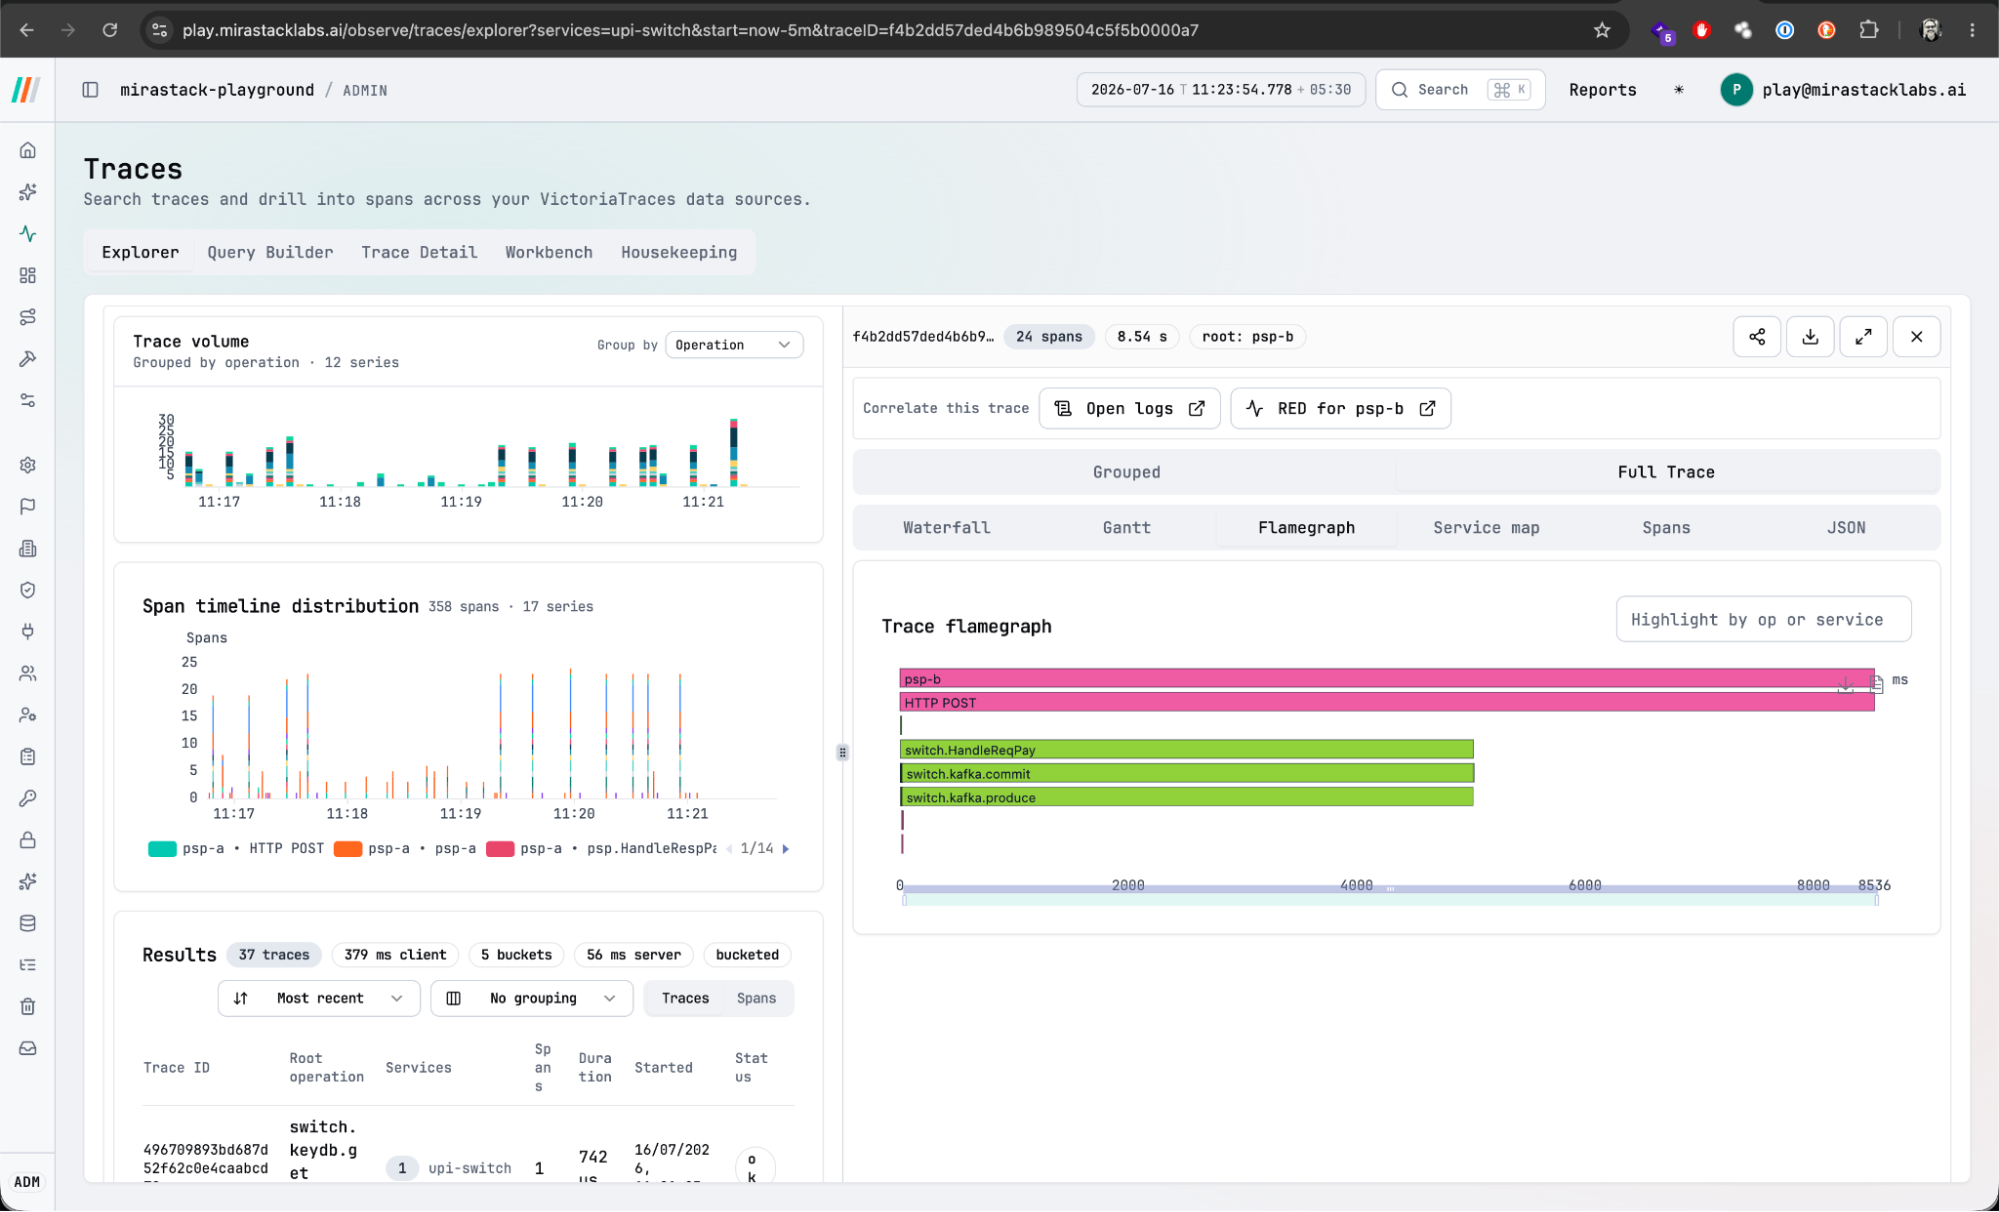
Traces Exploration
Query traces by service, operation, error status, or latency. Visualize waterfall span causality on a timeline, Gantt charts, and service dependency graphs.
Service Observability
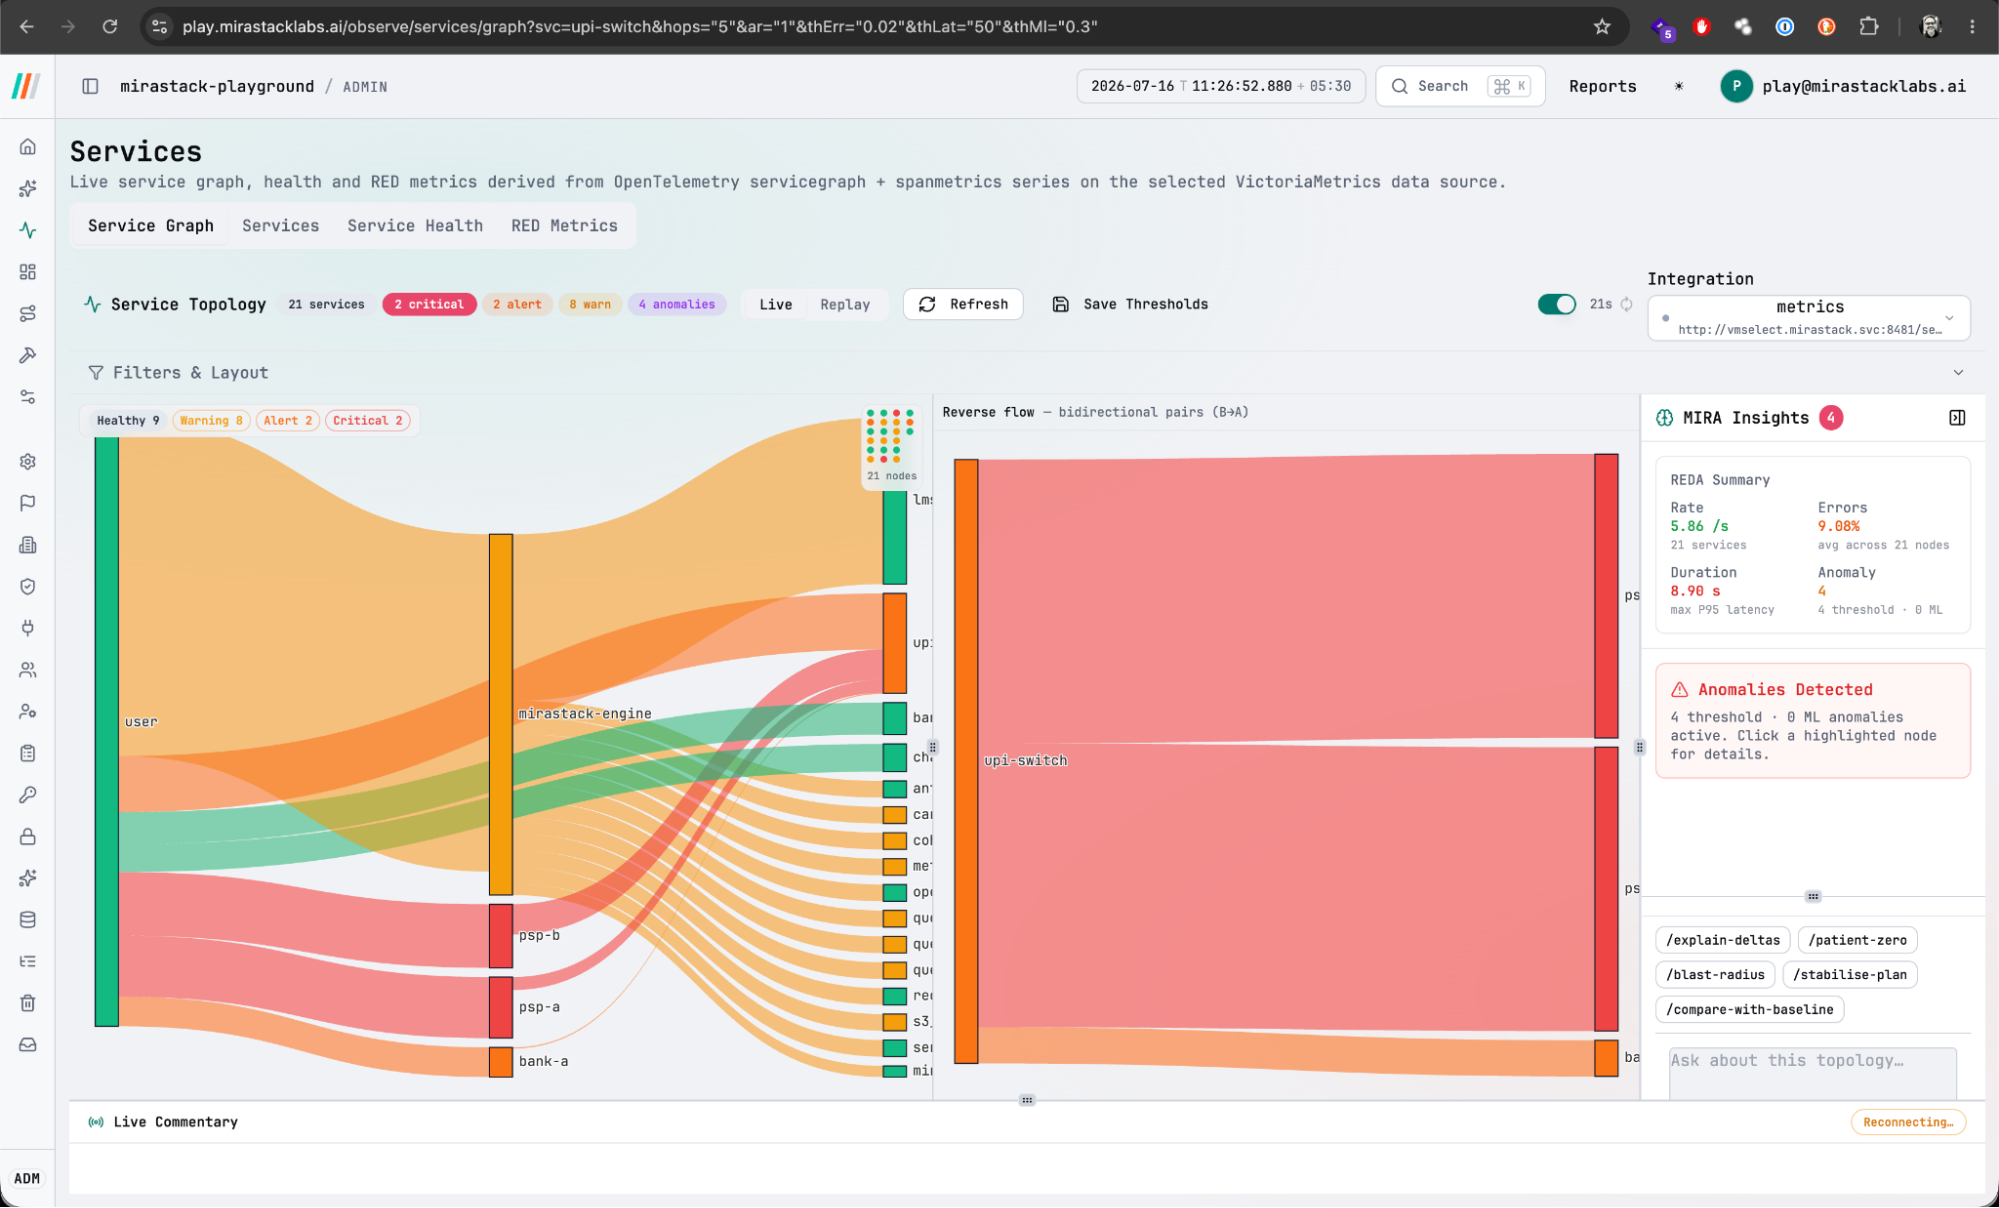
Auto-discovered service dependency graph. Zoom to nodes, inspect RED health metrics (Rate / Errors / Duration), and drill directly into traces.
MIRA: Agentic Observability Workbench
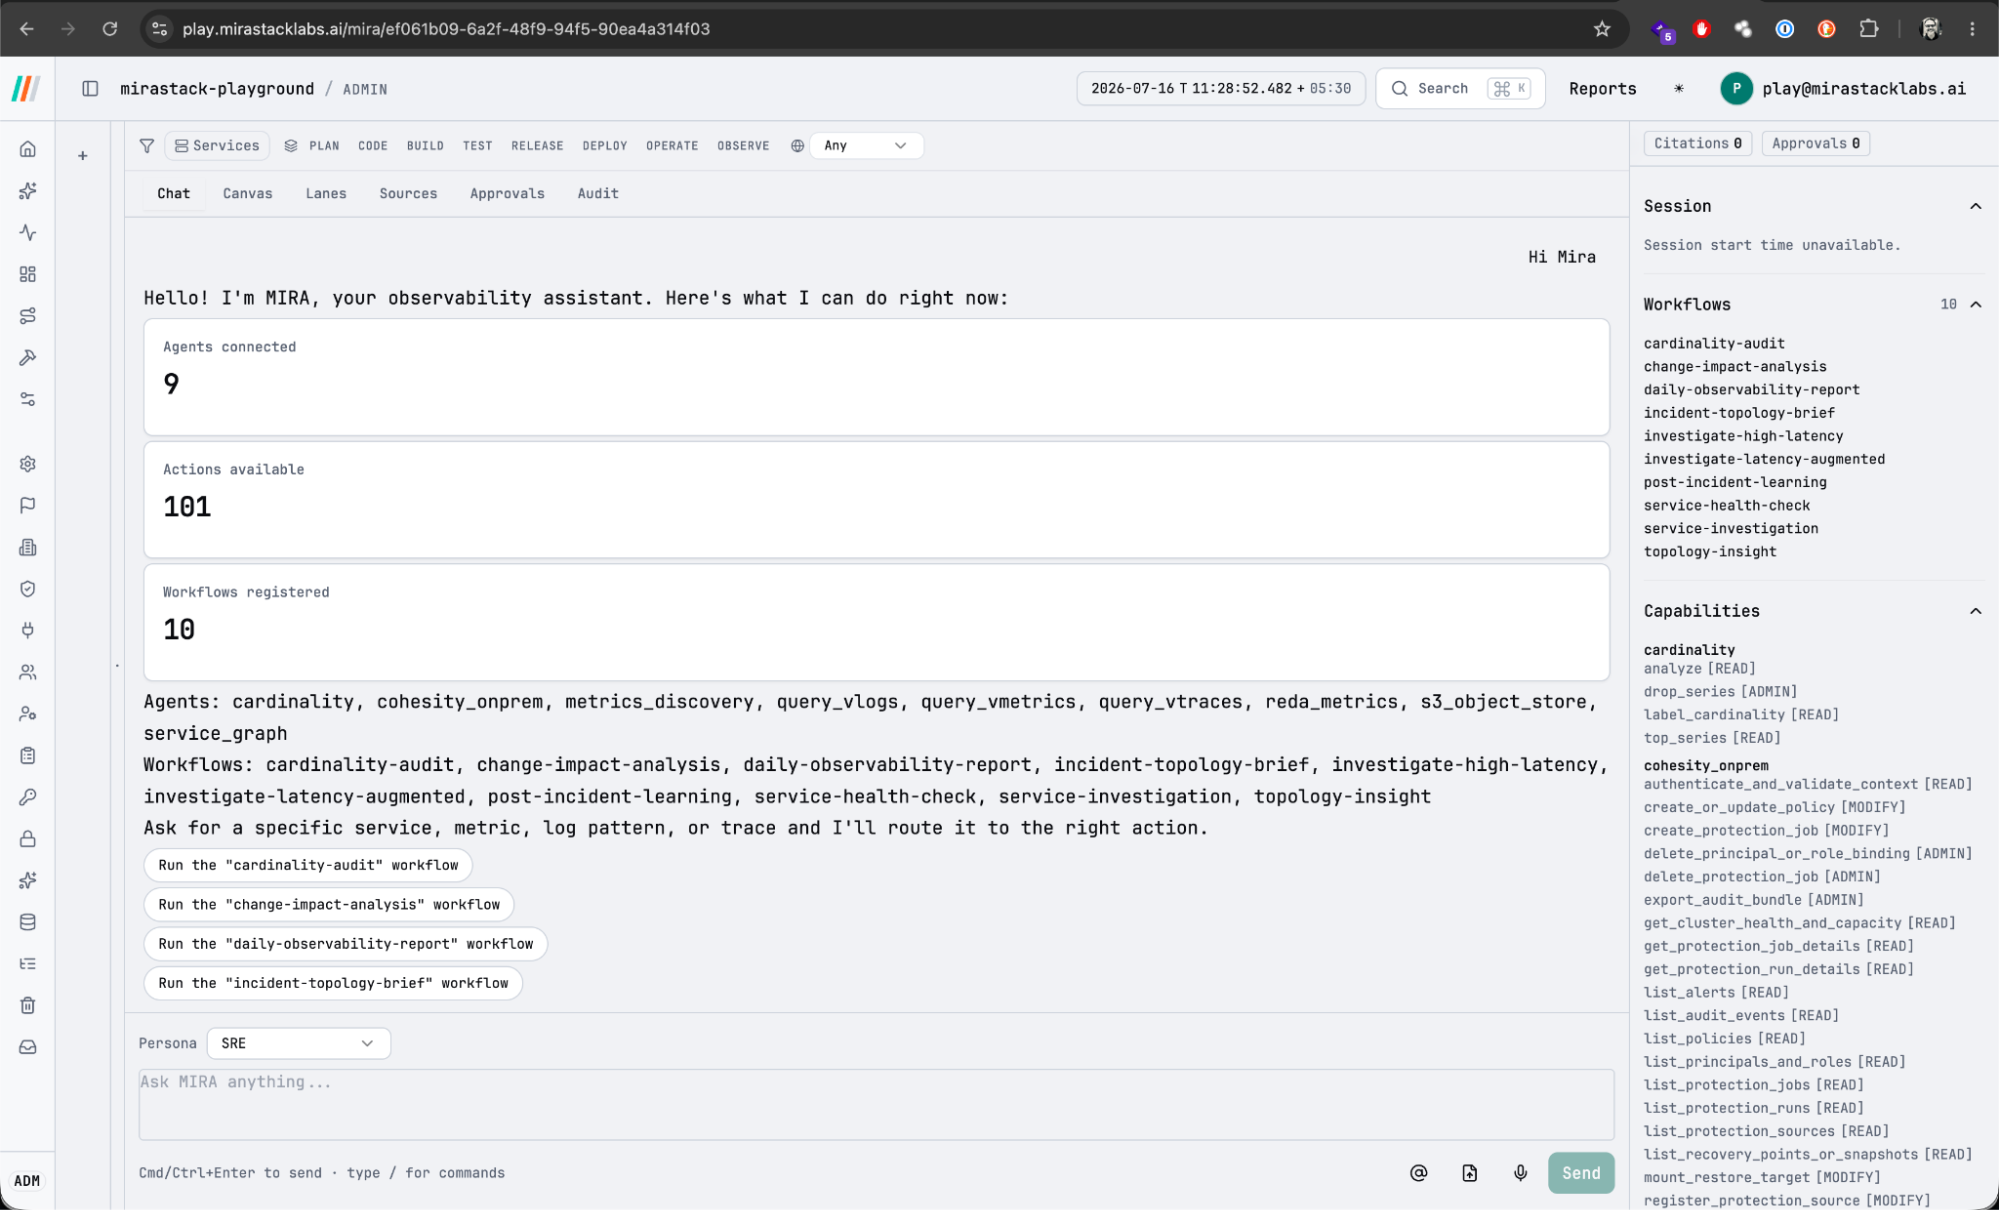
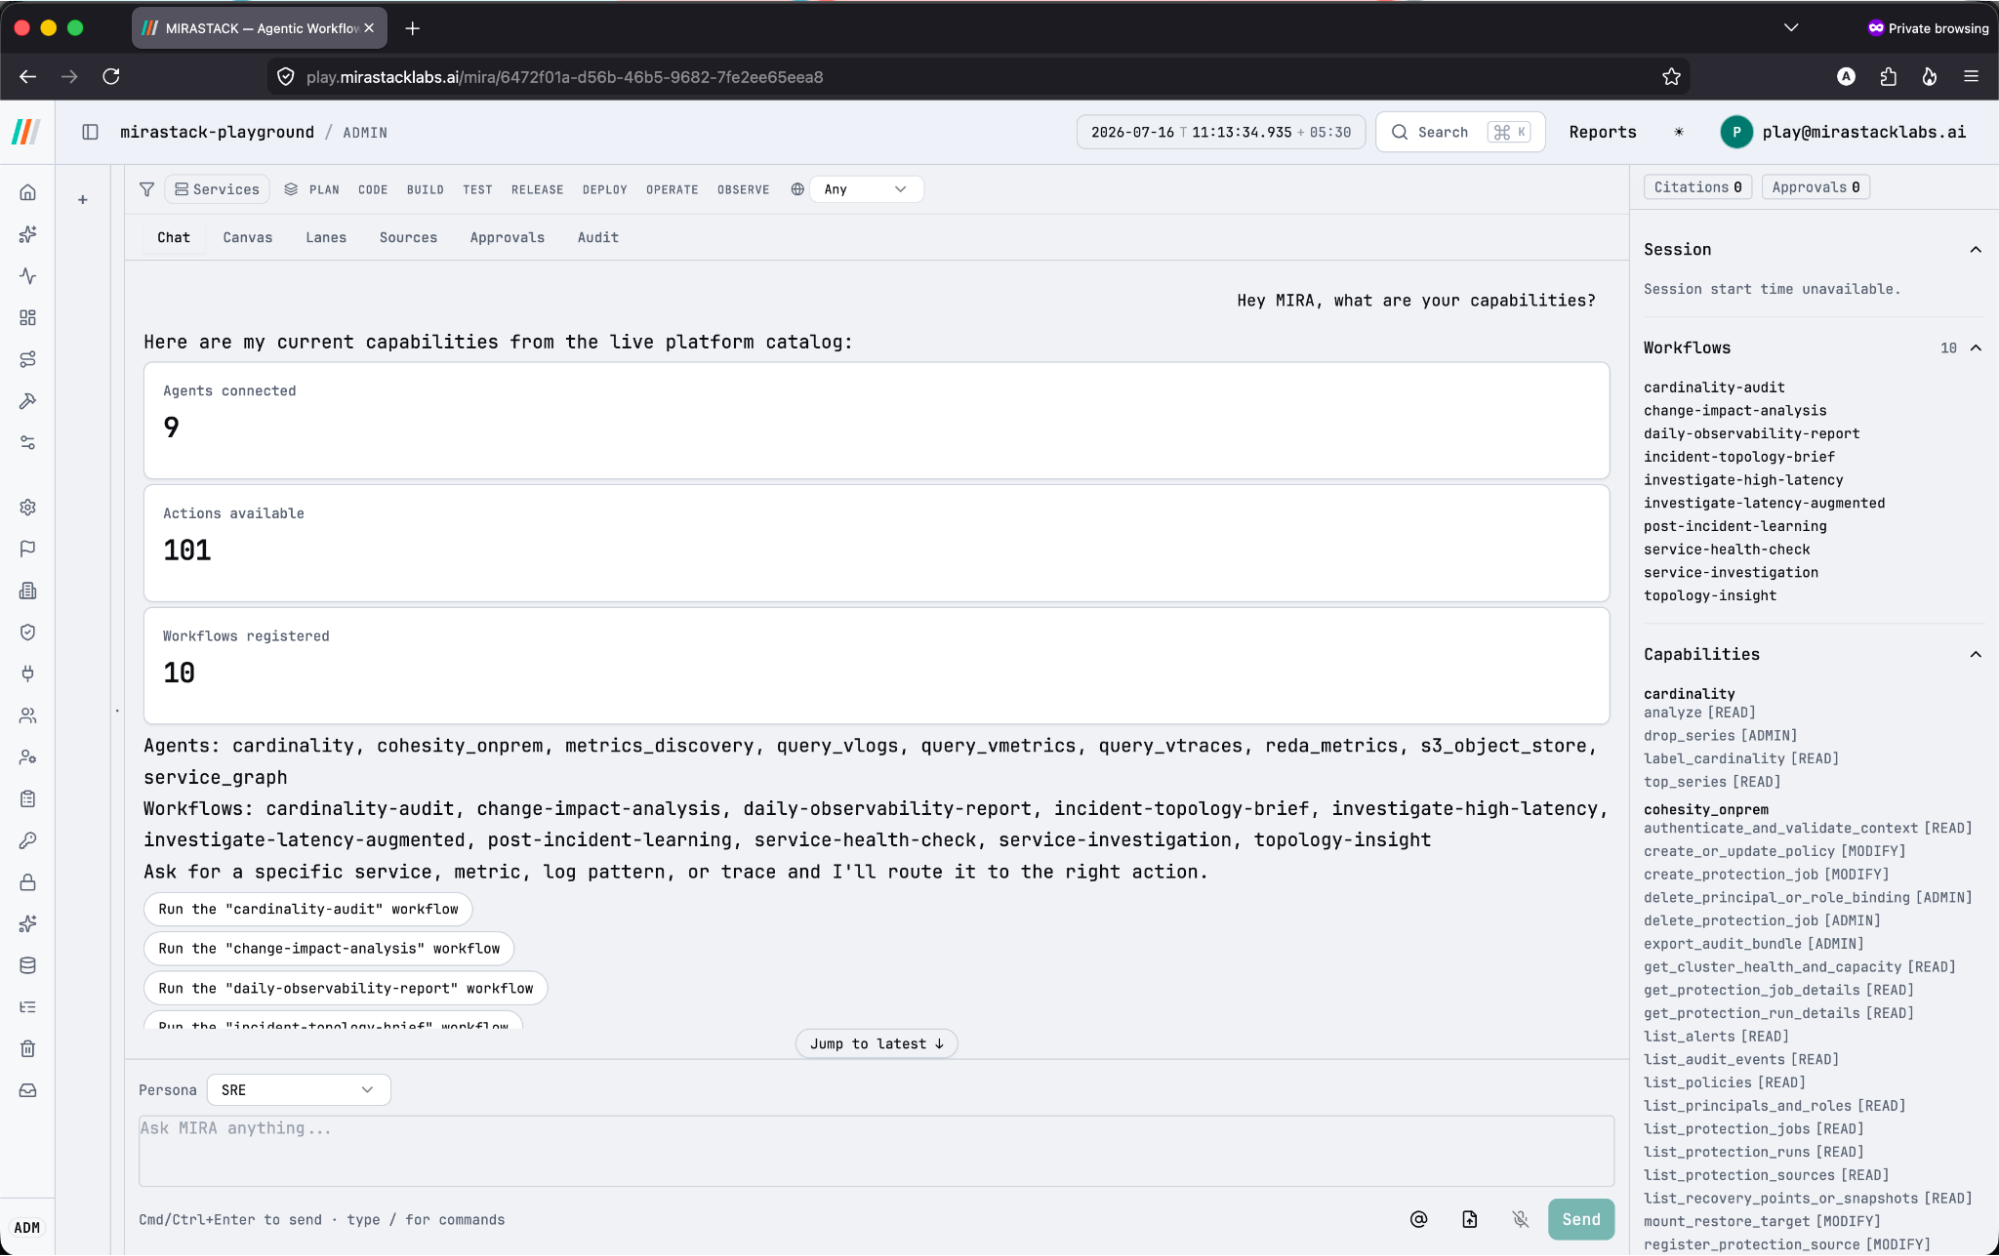
MIRA (MirastackLabs Intelligent Research Assistant) provides a chat-first interface to ask complex operational questions, orchestrating specialized agents to correlate signals and perform root cause analysis.
Conversational Workbench
Ask MIRA questions like "Why are errors increasing?" or "What happened between 3 and 4 PM?". MIRA auto-correlates metrics, logs, and traces, providing a detailed timeline and hypothesis.
AI Capabilities & 5-Why RCA
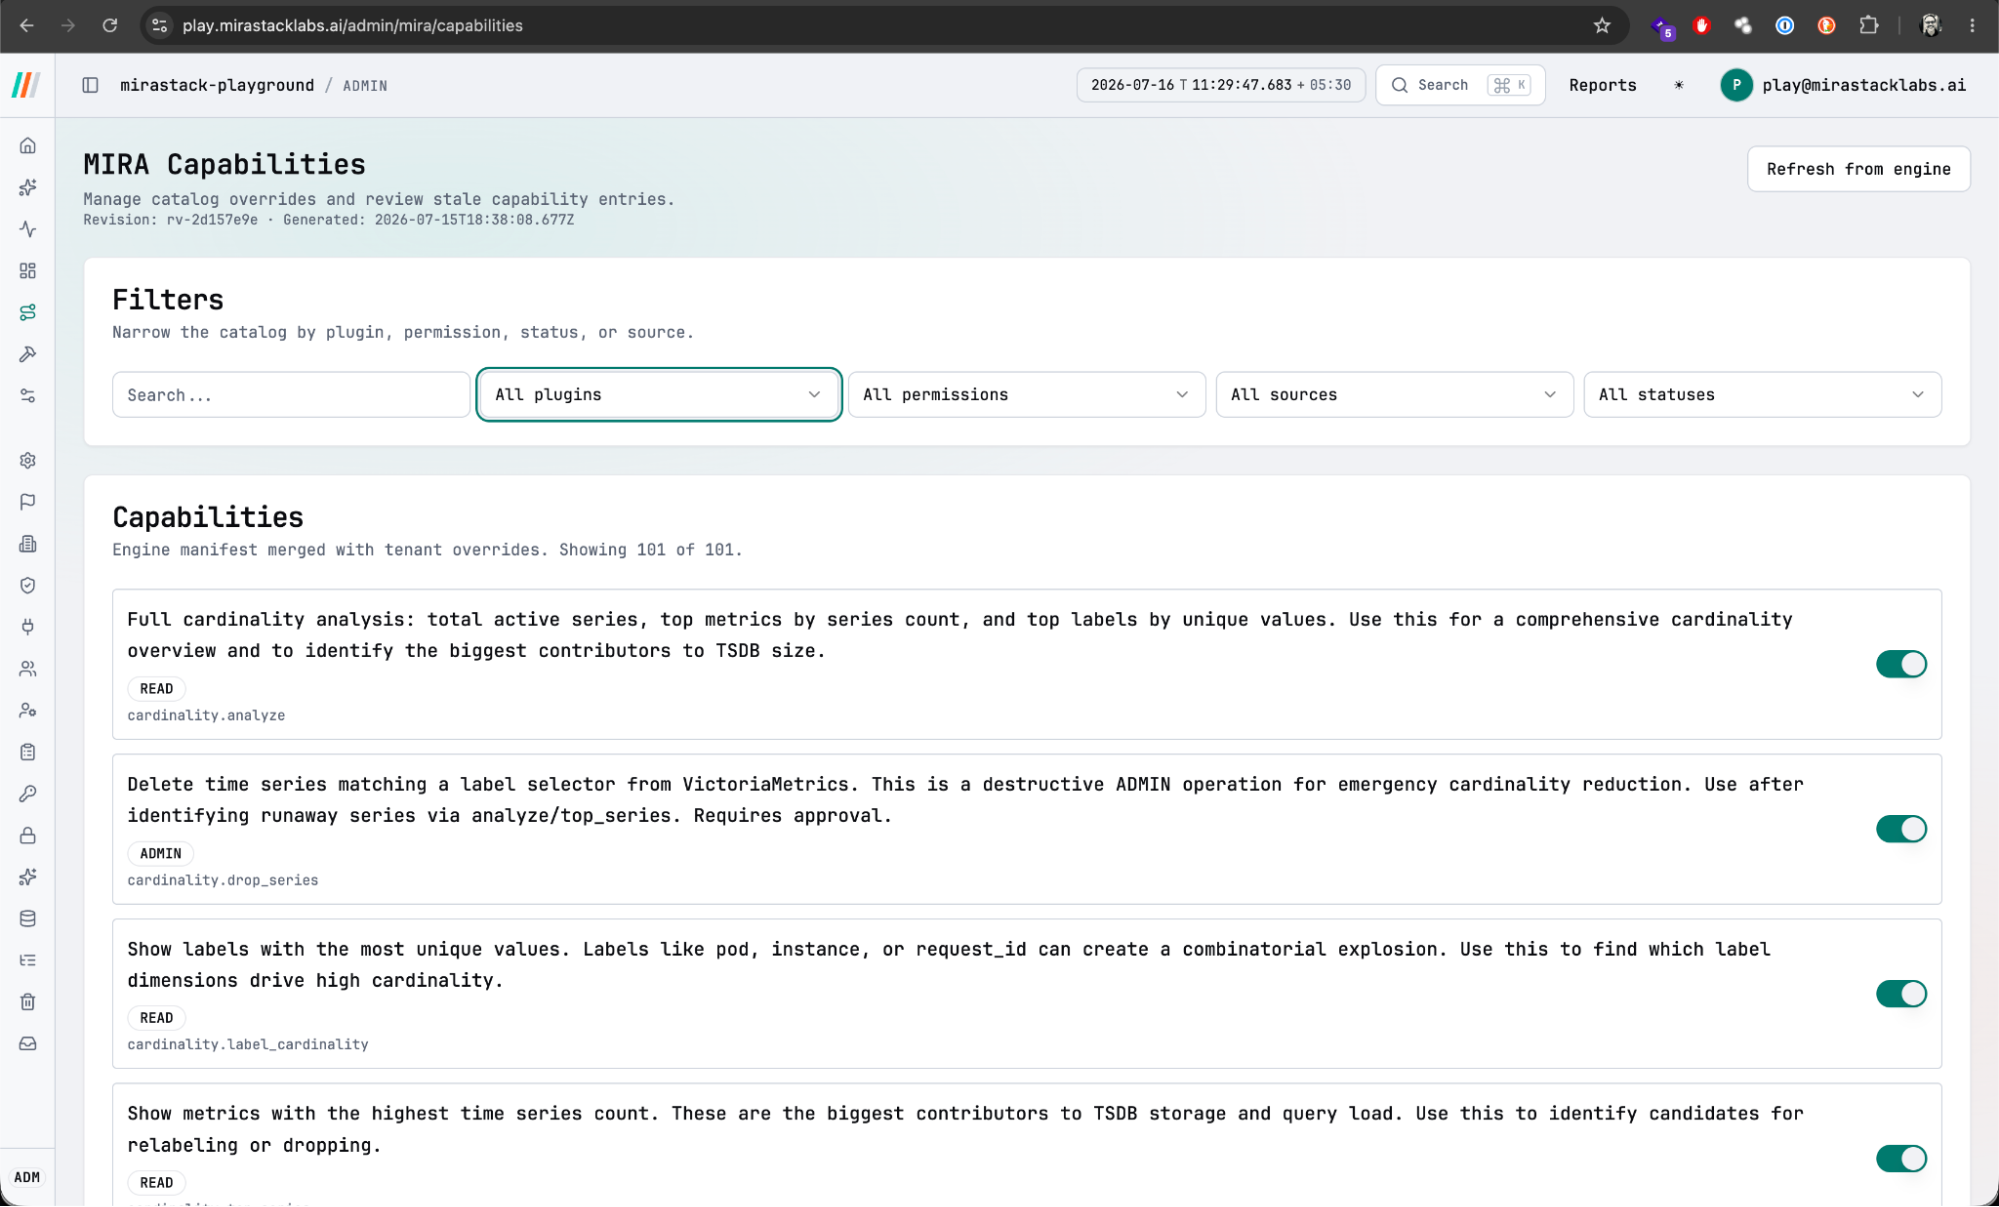
Autonomous 5YRCA (Five-Why Root Cause Analysis) engine. Correlates failures with infrastructure, application metrics, logs, traces, and business metrics, citing specific changes as potential causes.
Model & Provider Control
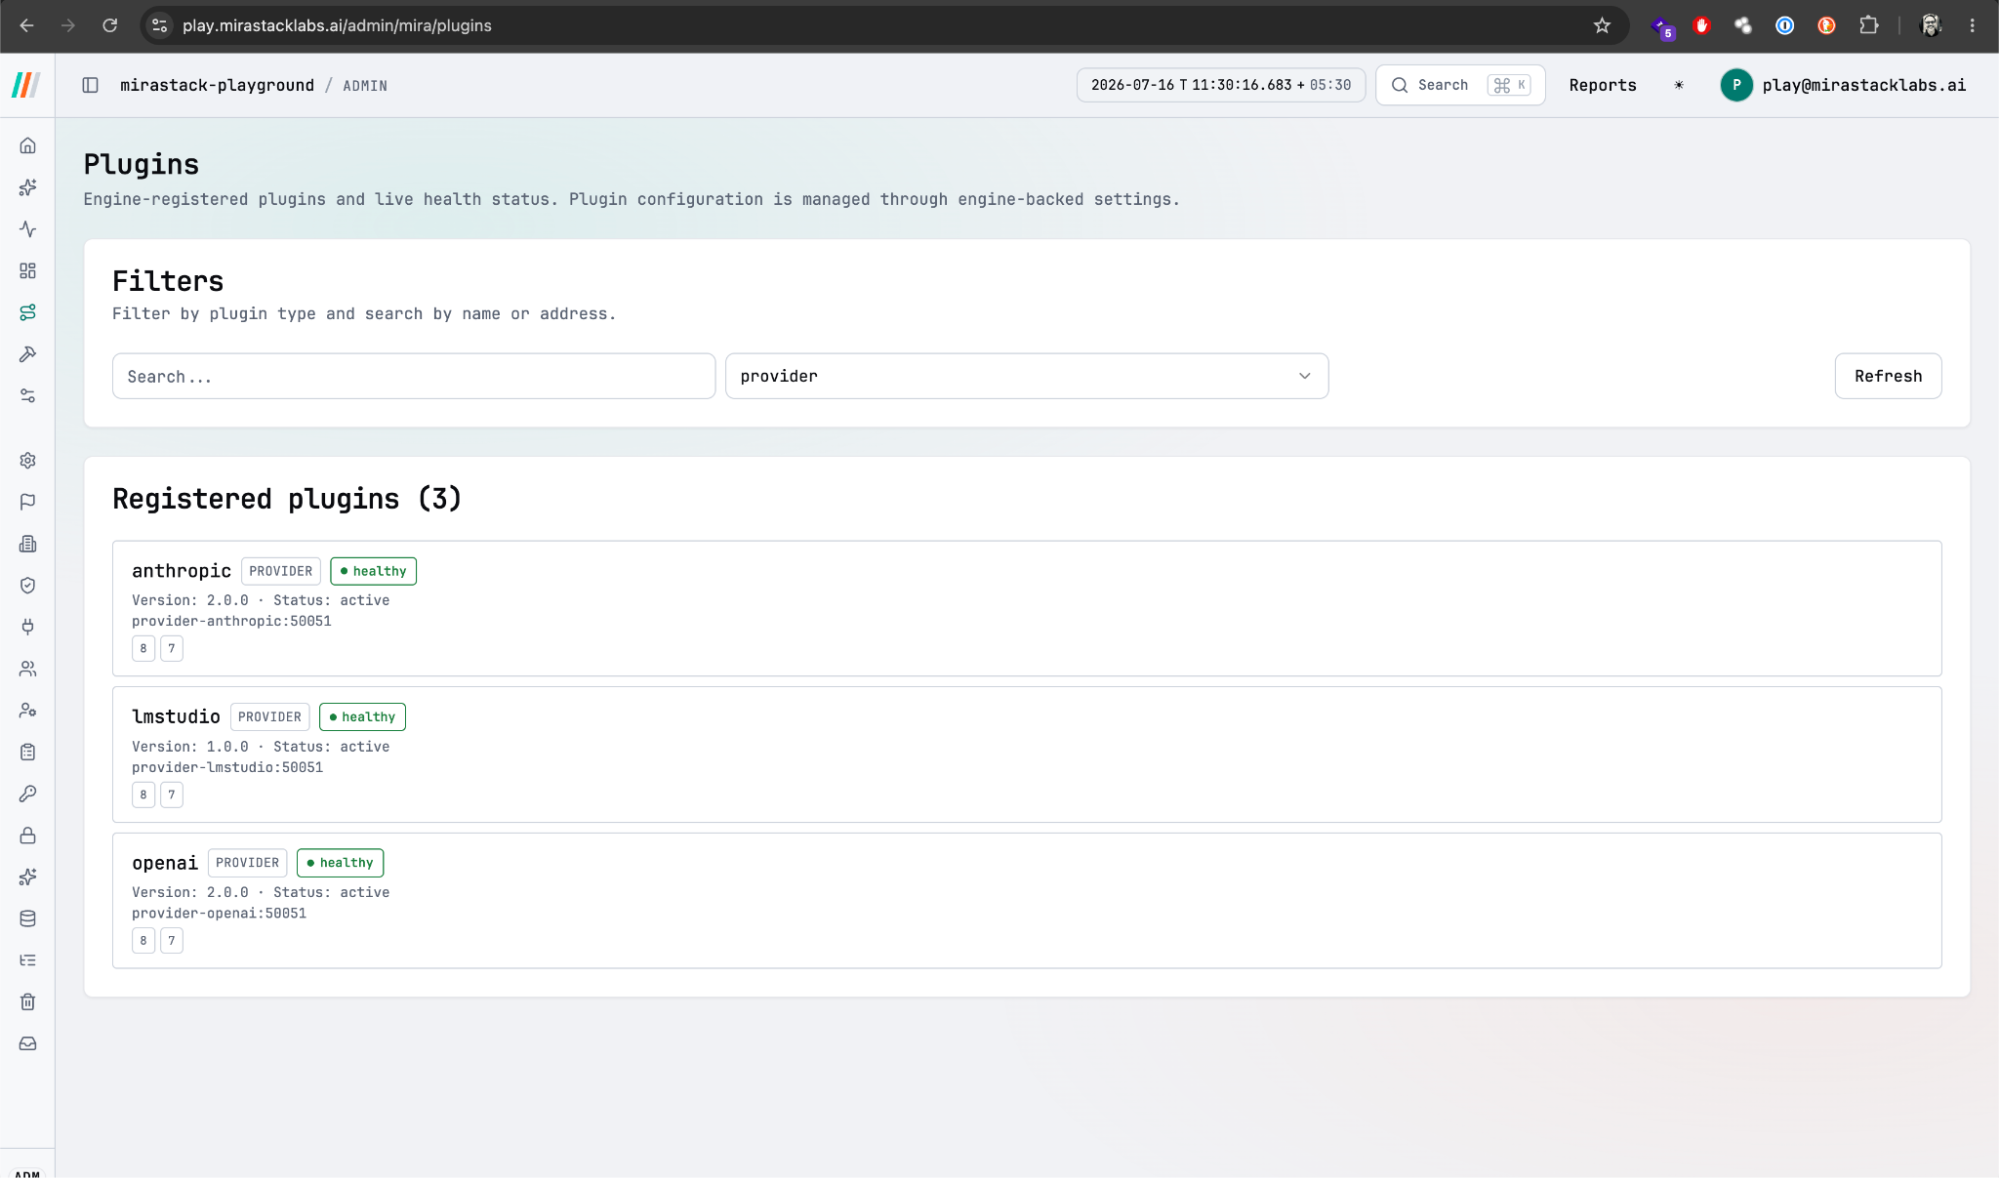
Bring-Your-Own LLM: run on your own infrastructure with Ollama, LM Studio, or vLLM. Choose lightweight models for cost-sensitive queries, and track token usage and cost in real-time.
Generative UI (18 Component Kinds)
MIRA streams UI frames to the browser as a stream of 18 component kinds, all rendered as first-class React components (charts, tables, KPI cards, trace timelines, and React Flow DAGs).
Alerting & On-Call Control Plane
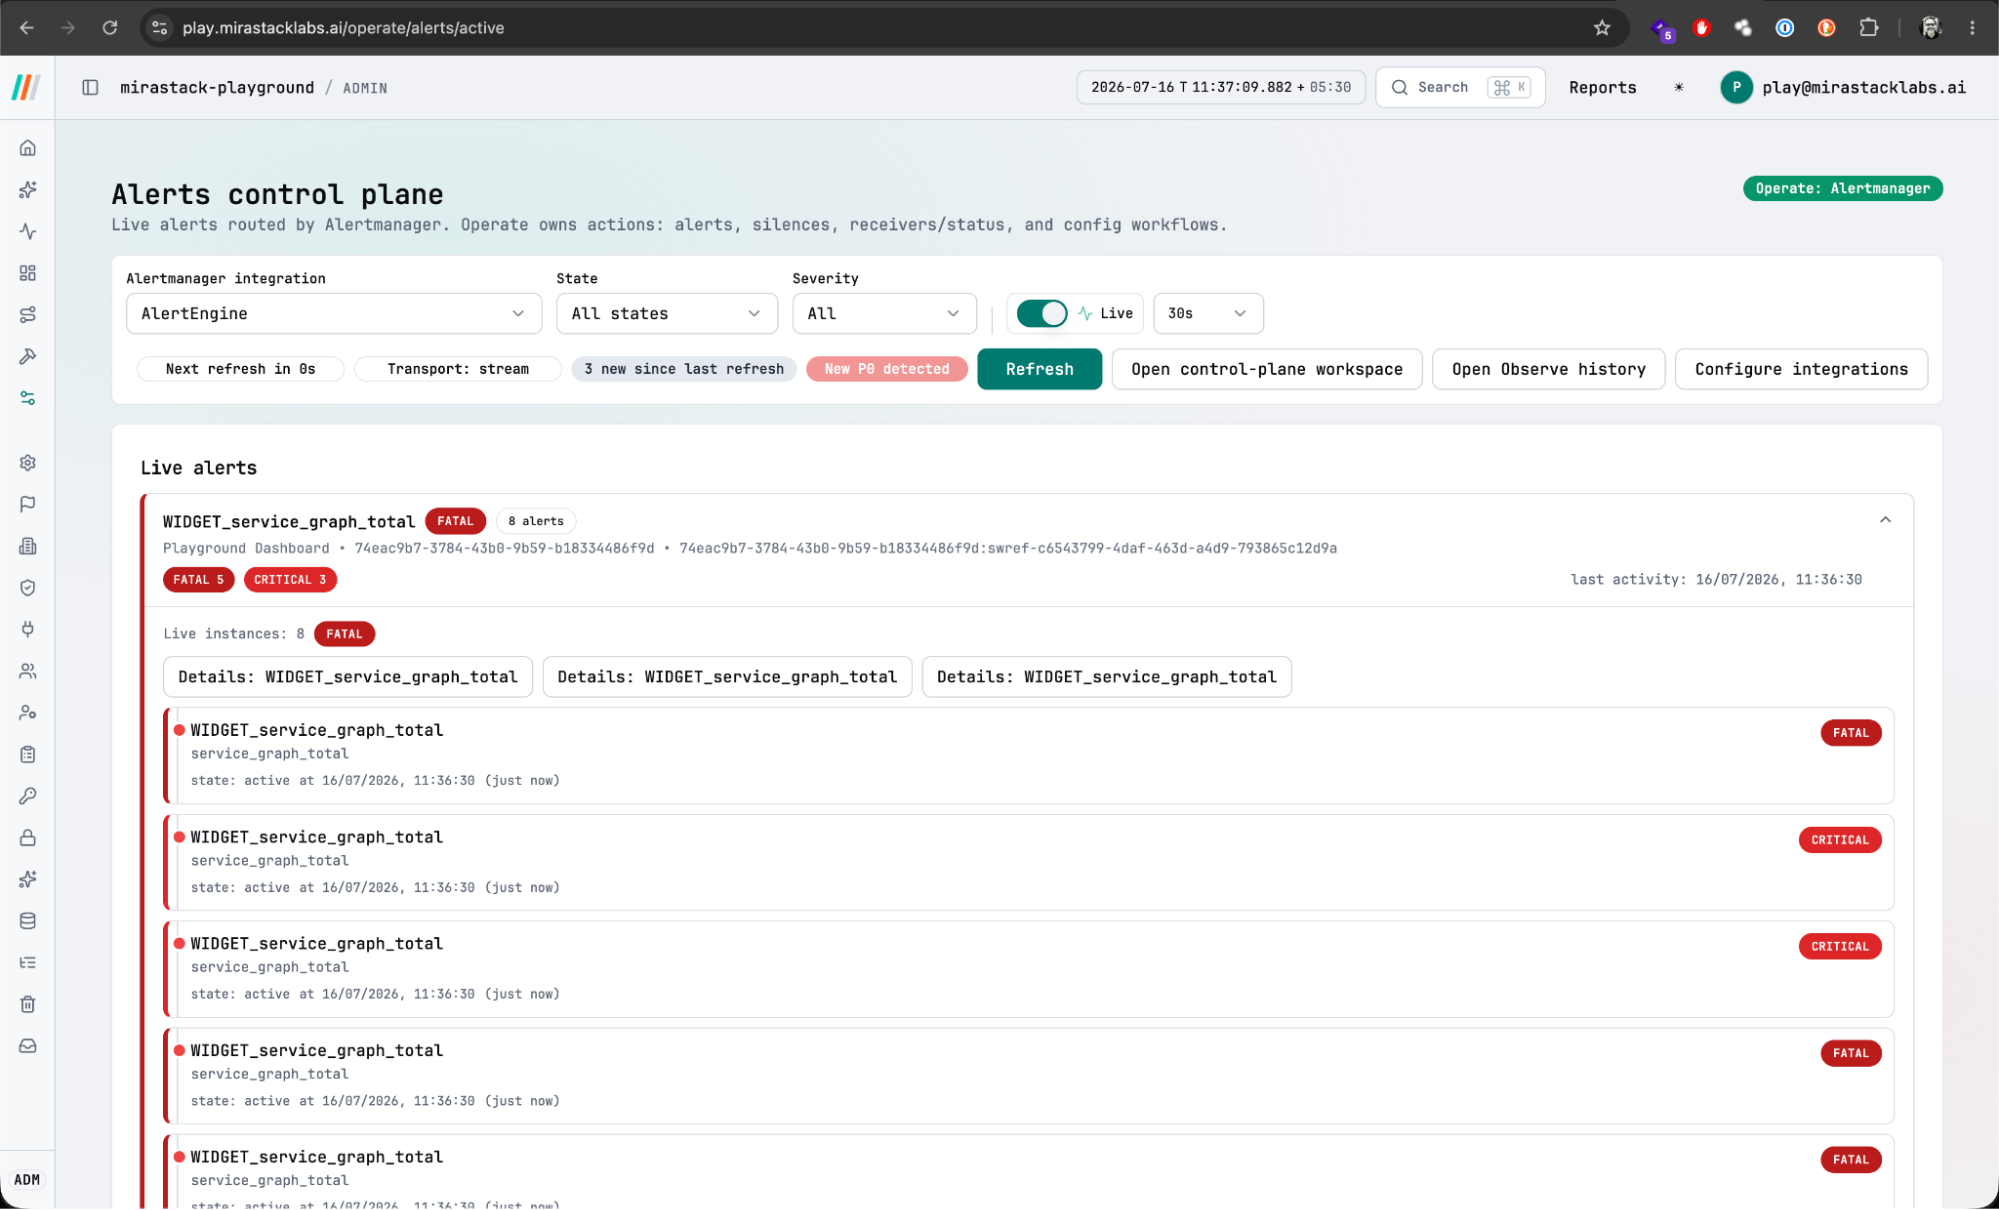
MIRASTACK's Operate portal is a complete alerting and on-call control plane built on a hardened fork of Prometheus Alertmanager, adding multi-tenancy, sealed secrets, and GitOps configuration workflows.
Hardened Alertmanager Core
100% upstream Alertmanager compatibility with tree-based routing, silences, inhibitions, and clustering. Adds tenant-scoped runtime configuration stored in MariaDB and AES-256-GCM encrypted receiver credentials.
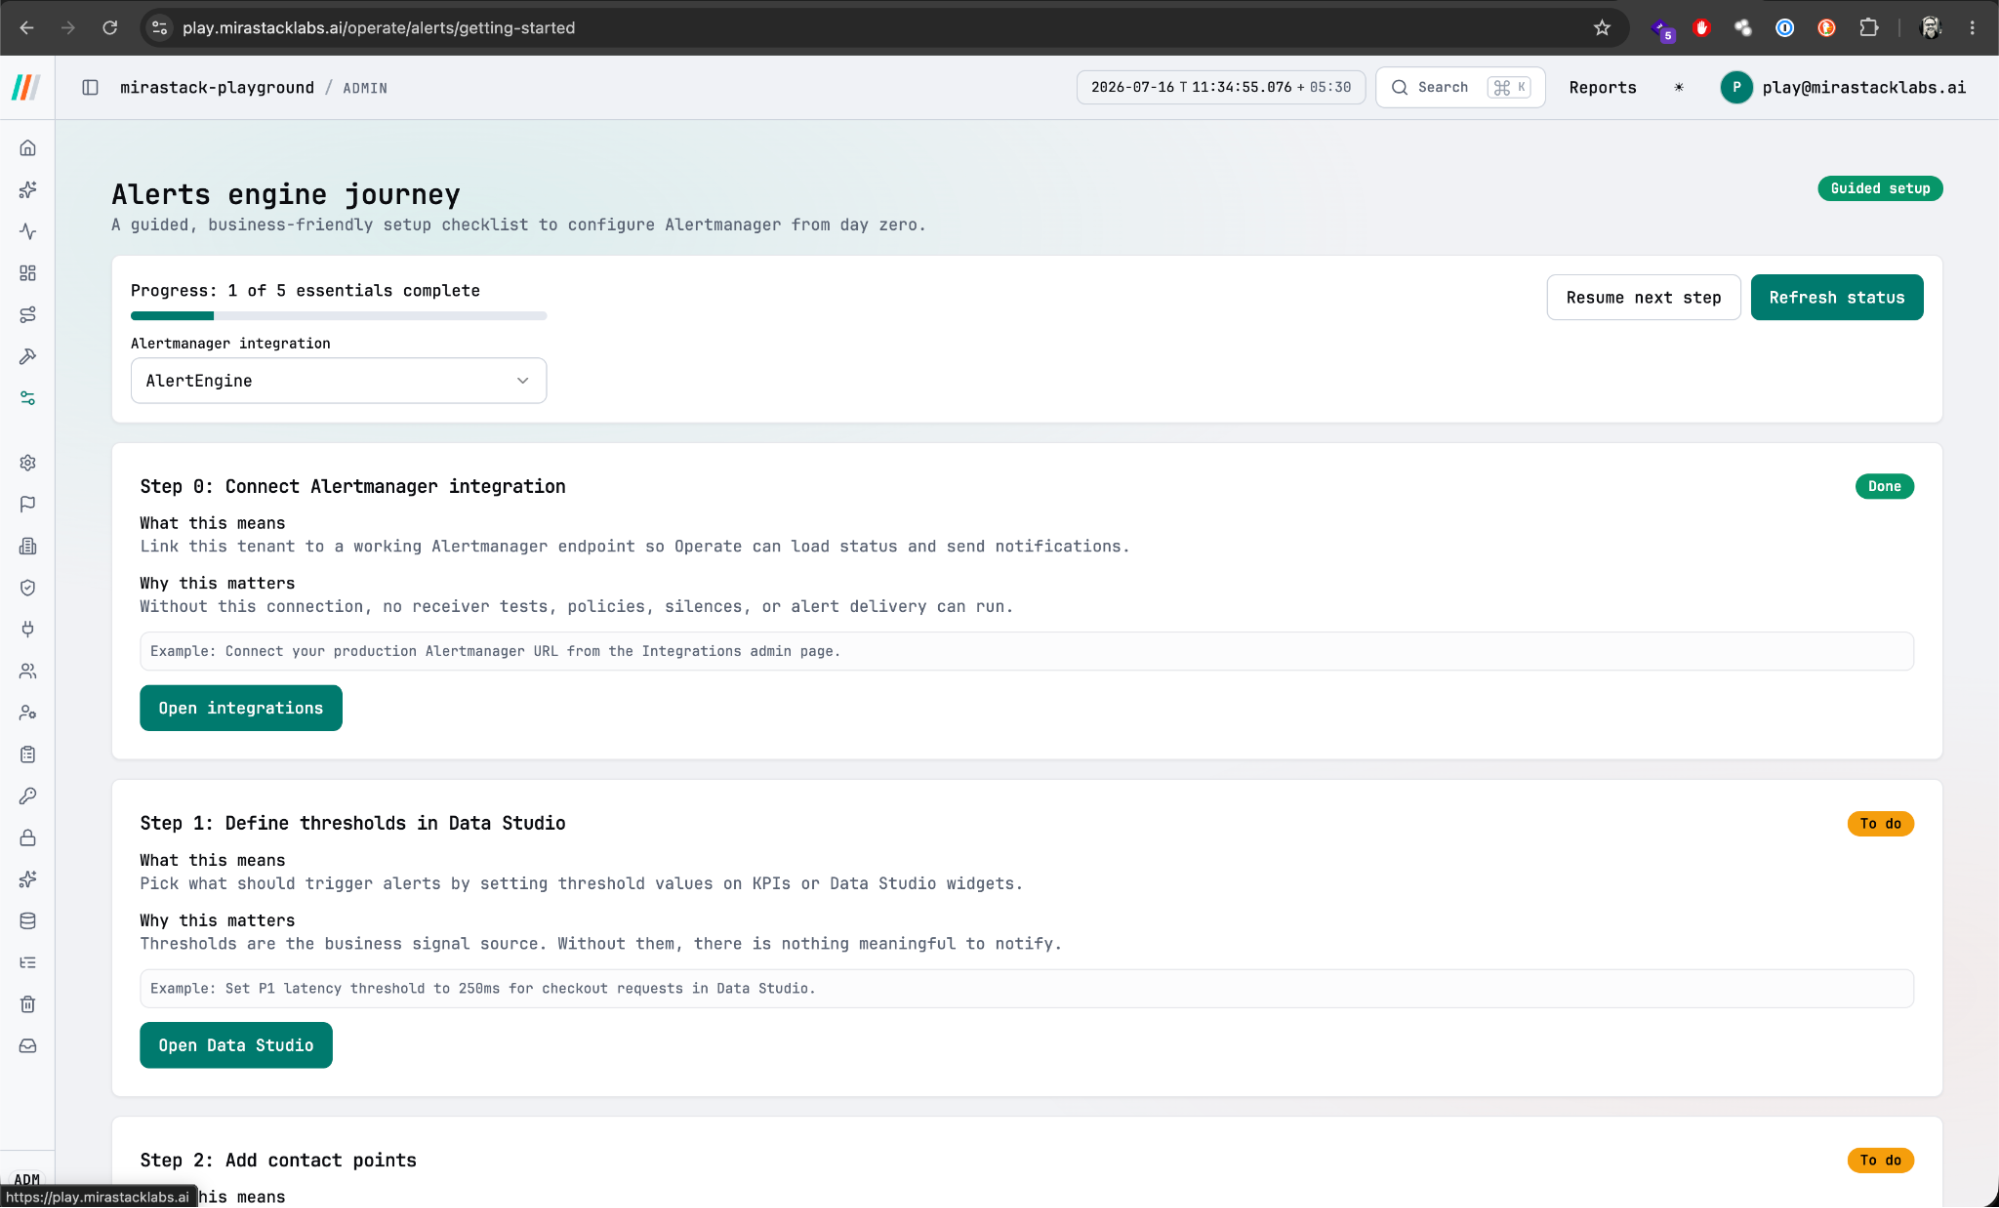
Operate Portal Features
Real-time alert stream with drill-down, silencing, and acknowledgment. On-call management with schedules, escalation policies, rotations, and SLO error budget tracking.
Feature Availability by License Tier
MIRASTACK comes in four license tiers, unlocking features progressively to match your operating scale.
| Feature / Capability | Neo (PoV) | Pro (Entry) | Max (Mid) | Ultra (Top) |
|---|---|---|---|---|
| Observe Portal (Metrics, Logs, Traces, Service Topology) | Yes | Yes | Yes | Yes |
| eBPF Continuous Profiling (Linux) | Yes | Yes | Yes | Yes |
| MIRA Conversational Chat (Read-Only) | Yes | Yes | Yes | Yes |
| BYO-LLM / On-Premises AI Inference (Ollama, vLLM) | Yes | Yes | Yes | Yes |
| Multi-Tenancy & Air-Gapped Deployment | Yes | Yes | Yes | Yes |
| Statistical Correlation Engine & Early Warning | No | Yes | Yes | Yes |
| AI-Driven 5YRCA (Five-Why Root Cause Analysis) | No | Yes | Yes | Yes |
| Agentic Workflows (Lane 1/2/3 Execution Model) | No | Yes | Yes | Yes |
| Custom Dashboards & Dashboard Marketplace | No | No | Yes | Yes |
| Data Studio (No-Code Composer) | No | No | Yes | Yes |
| Unified Multi-Datasource (Tech + Business) | No | No | Yes | Yes |
| Business Analytics (ClickHouse SQL Warehouse) | No | No | Yes | Yes |
| Scheduled Reports & Automated Distribution | No | No | Yes | Yes |
| On-Call & SLO Management Control Plane | No | No | Yes | Yes |
| CBOM Scanning (CycloneDX / ECMA-424 Cryptography) | No | No | No | Yes |
| Network Discovery & Passive TLS Posture Analysis | No | No | No | Yes |
| Business Flow & Customer Journey Analysis | No | No | No | Yes |
Open Standards & Collaborations
MIRASTACK is built on open standards to prevent vendor lock-in and ensure data portability. We actively collaborate with open-source ecosystems like VictoriaMetrics.
Interoperable and Future-Proof
Our telemetry ingestion is 100% OpenTelemetry-native, and our metrics engine is fully Prometheus PromQL compatible. We contribute back to the open-source community, licensing our core observability agents under AGPL v3.
- OpenTelemetry Ingest: Native support for OTLP metrics, logs, and traces.
- Prometheus & Jaeger APIs: 100% compatible with existing dashboards and Jaeger clients.
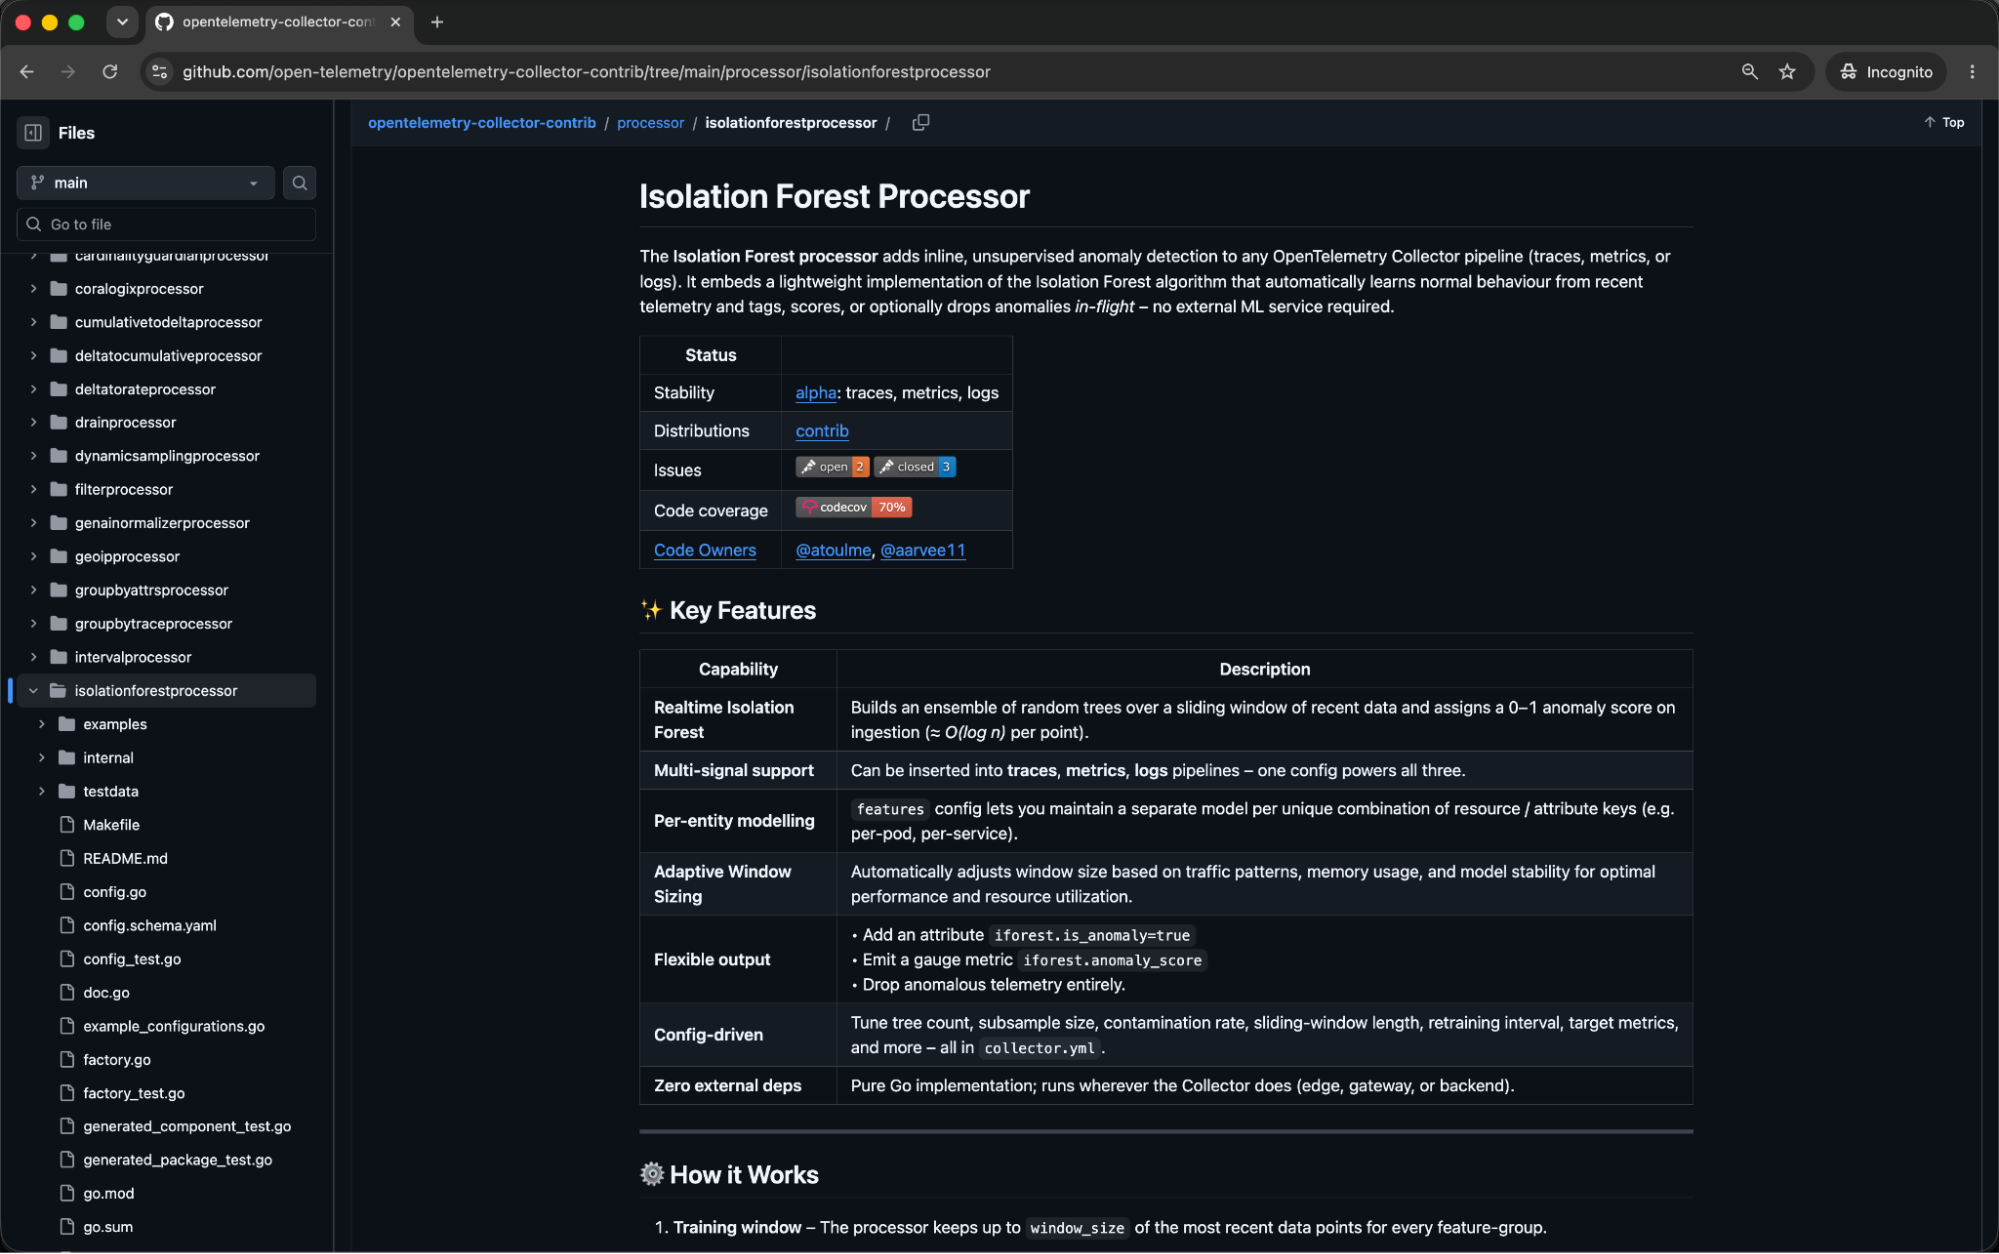
- AGPL v3 Agents: Open-source agents for correlation, RCA, anomaly detection, and service graphs.
Technical Deep Dives & Architectural Comparisons
Explore detailed technical specifications of the MIRASTACK Platform's capabilities or see how our sovereign architecture compares to legacy SaaS platforms.
Observability Features List
A highly detailed technical catalog of the MIRASTACK Platform's capabilities across metrics, logs, traces, continuous profiling, MIRA AI, alerting, and scheduled reporting.
Sovereign vs. SaaS Architectural Comparison
A paradigm-focused comparison matrix highlighting the core structural advantages of the MIRASTACK Platform (Sovereignty, Cost-Efficiency, Agentic AI, and BI Consolidation) against standard SaaS-only monitoring platforms.
Deploy Sovereign Intelligence. Consolidate Your Stack.
Start with any tier; scale to Enterprise as your needs grow. Remove vendor lock-in, eliminate cloud egress fees, and retire separate business intelligence licenses.