 MIRASTACK Platform Features
MIRASTACK is a sovereign, AI-native platform that unifies the two disciplines most enterprises still run as separate, expensive silos: technology observability and business analytics. This technical catalog details the capabilities that ship today.
One Platform for Technology and Business Signals
Traditional monitoring vendors optimize for a single dimension — metrics, logs, or traces — and treat business data as somebody else's problem. Business-intelligence vendors do the inverse, remaining blind to the systems that generate the revenue. MIRASTACK collapses that divide into a single, self-hosted platform where operational telemetry and business data live side by side.
The Architecture of Sovereignty: MIRASTACK runs entirely on your infrastructure — on-premises, air-gapped, or in your private cloud — so your operational and commercial data never leaves your control. It connects to purpose-built observability stores and to SQL-warehouse-class business backends through the same integration model, renders both through a single visual experience, and lets an AI assistant investigate across every signal without the analyst ever writing a query.
MIRA Intelligence: Agentic Observability
Every observability query is accessible through natural language via MIRA (MirastackLabs Intelligent Research Assistant). Ask in English; MIRA routes your query through the appropriate agents, correlates signals, and synthesizes answers with evidence.
Platform Operator
The human SRE or platform engineer who interacts with the system, initiates queries, and provides authorization.
MIRA Engine
Stateless orchestration core enforcing wire-level governance via EGAProtocol.
- State Management
- Context Assembly
- Human-in-the-Loop Governance
- 5AG Governance Framework
- Telemetry Observability
Inference & Dispatch
MIRA calls LLM Providers for reasoning and dispatches agents via the SDK.
Enterprise Ecosystem
The target environment where agents execute authorized actions under strict boundaries.
Consumer-Grade Agentic AI
e.g., LangGraph, OpenClaw, AutoGen
- No wire-level authentication or identity propagation.
- Bypassable, application-level approval checks.
- No immutable audit trails for strict regulatory compliance.
- High risk of runaway, destructive loops on production infrastructure.
Enterprise-Grade EGAProtocol Governance
MIRASTACK Platform Core
- Cryptographically verifiable identity on every message envelope.
- Mandatory human-in-the-loop approval primitives built into the wire protocol.
- Immutable audit trails following OpenTelemetry semantic conventions.
- Strict permission scopes (READ, MODIFY, DESTROY, ADMIN) enforced on every action.
Authoring the Standard: EGAProtocol
The MIRASTACK Platform is the reference implementation of EGAProtocol (Engine Governed Agents Protocol), an open-standard wire protocol authored by MIRASTACK LABS to bring strict enterprise discipline to AI agents. While Anthropic’s MCP defines how LLMs access local tools, and Google’s A2A defines how peer agents coordinate, EGAProtocol defines the mandatory governance layer between the orchestration engine and dispatched agents. Every message sent over EGAProtocol carries cryptographically-signed metadata enforcing the 5AG Governance Framework (Authentication, Authorization, Audit, Approvals, Alerts) directly at the wire level.
Pre-defined Operations Agentic Lane
LANE #1Only used for invoking using an existing workflow based on purely understanding the intent. The AI maps natural language queries directly to rigid, pre-defined, and fully-tested enterprise playbooks.
Autonomous Agentic Lane
LANE #2When a user sends a prompt, the MIRA Engine and LLM realize that this requires a fully new workflow that needs to be constructed from scratch. The engine dynamically builds and executes a brand-new workflow altogether, visualizing the execution graph in real-time.
AI-Improvised Agentic Lane
LANE #3Existing Lane #1 workflows are analyzed and improvised by the LLM in real-time to make them better, improving the user's already existing workflows. In simple words, enterprise-standard workflows are dynamically optimized using AI, capturing and continuously optimizing institutional tribal knowledge.
Autonomous Investigation
Chat-driven multi-signal analysis that orchestrates specialized agents.
- Chat-first interface (/mira) for natural language exploration
- Orchestrates 7+ specialized agents (RCA, Service Graph, etc.)
- Multi-phase: Analyze intent, Execute agents, Synthesize findings
- Evidence-backed answers citing specific metrics, logs, and spans
AI Analytical Capabilities
Advanced statistical and causal reasoning across all telemetry streams.
- Temporal ring analysis, blast-radius scoring, causal path inference
- Pearson/Spearman cross-signal metrics correlation
- Early Warning & Prediction using Isolation Forest ML
- SLO & Error Budget tracking and burn-rate alerting
- Generative UI streaming 18 distinct interactive React components
Model & Provider Control
Complete sovereignty over your choice of Large Language Models.
- Run on-premises with Ollama, LM Studio, or vLLM
- Connect to secure commercial APIs (OpenAI, Anthropic Claude)
- Model switching: lightweight for cost, powerful for complex RCA
- Real-time token cost and usage tracking by model and tenant
Data Stores: Open, Interoperable, Cost-Effective
The economics of observability are decided at the storage layer. MIRASTACK standardizes its telemetry foundation on the VictoriaMetrics observability stack — three purpose-built, single-responsibility engines proven at hyperscale.
VictoriaMetrics (Metrics TSDB)
A high-performance, cost-efficient time-series database compatible with Prometheus APIs.
- MetricsQL — extended PromQL with advanced rate and downsampling functions
- 100% Prometheus-compatible, works with all existing Grafana integrations
- Native ingestion of OTLP, InfluxDB, Graphite, and OpenTSDB protocols
- 10–20× better compression than Prometheus or InfluxDB
VictoriaLogs (JSON-Native Logs)
A purpose-built log store that treats logs as structured JSON records, not text blobs.
- LogSQL — SQL-like language with stream filters and field analytics
- Flexible data model with _time, _msg, _stream, and custom fields
- No schema lockdown — add fields dynamically on the fly
- ~10× cheaper storage and indexing than Elasticsearch or Grafana Loki
VictoriaTraces (Distributed Tracing)
A distributed tracing backend that stores OpenTelemetry spans and Jaeger traces.
- Jaeger-compatible REST API for trace search and service discovery
- LogsQL for span fields, trace metrics, and latency breakdowns
- Full OpenTelemetry semantics (spans, attributes, events, links)
- Compressed and deduplicated on write with zero collector tax
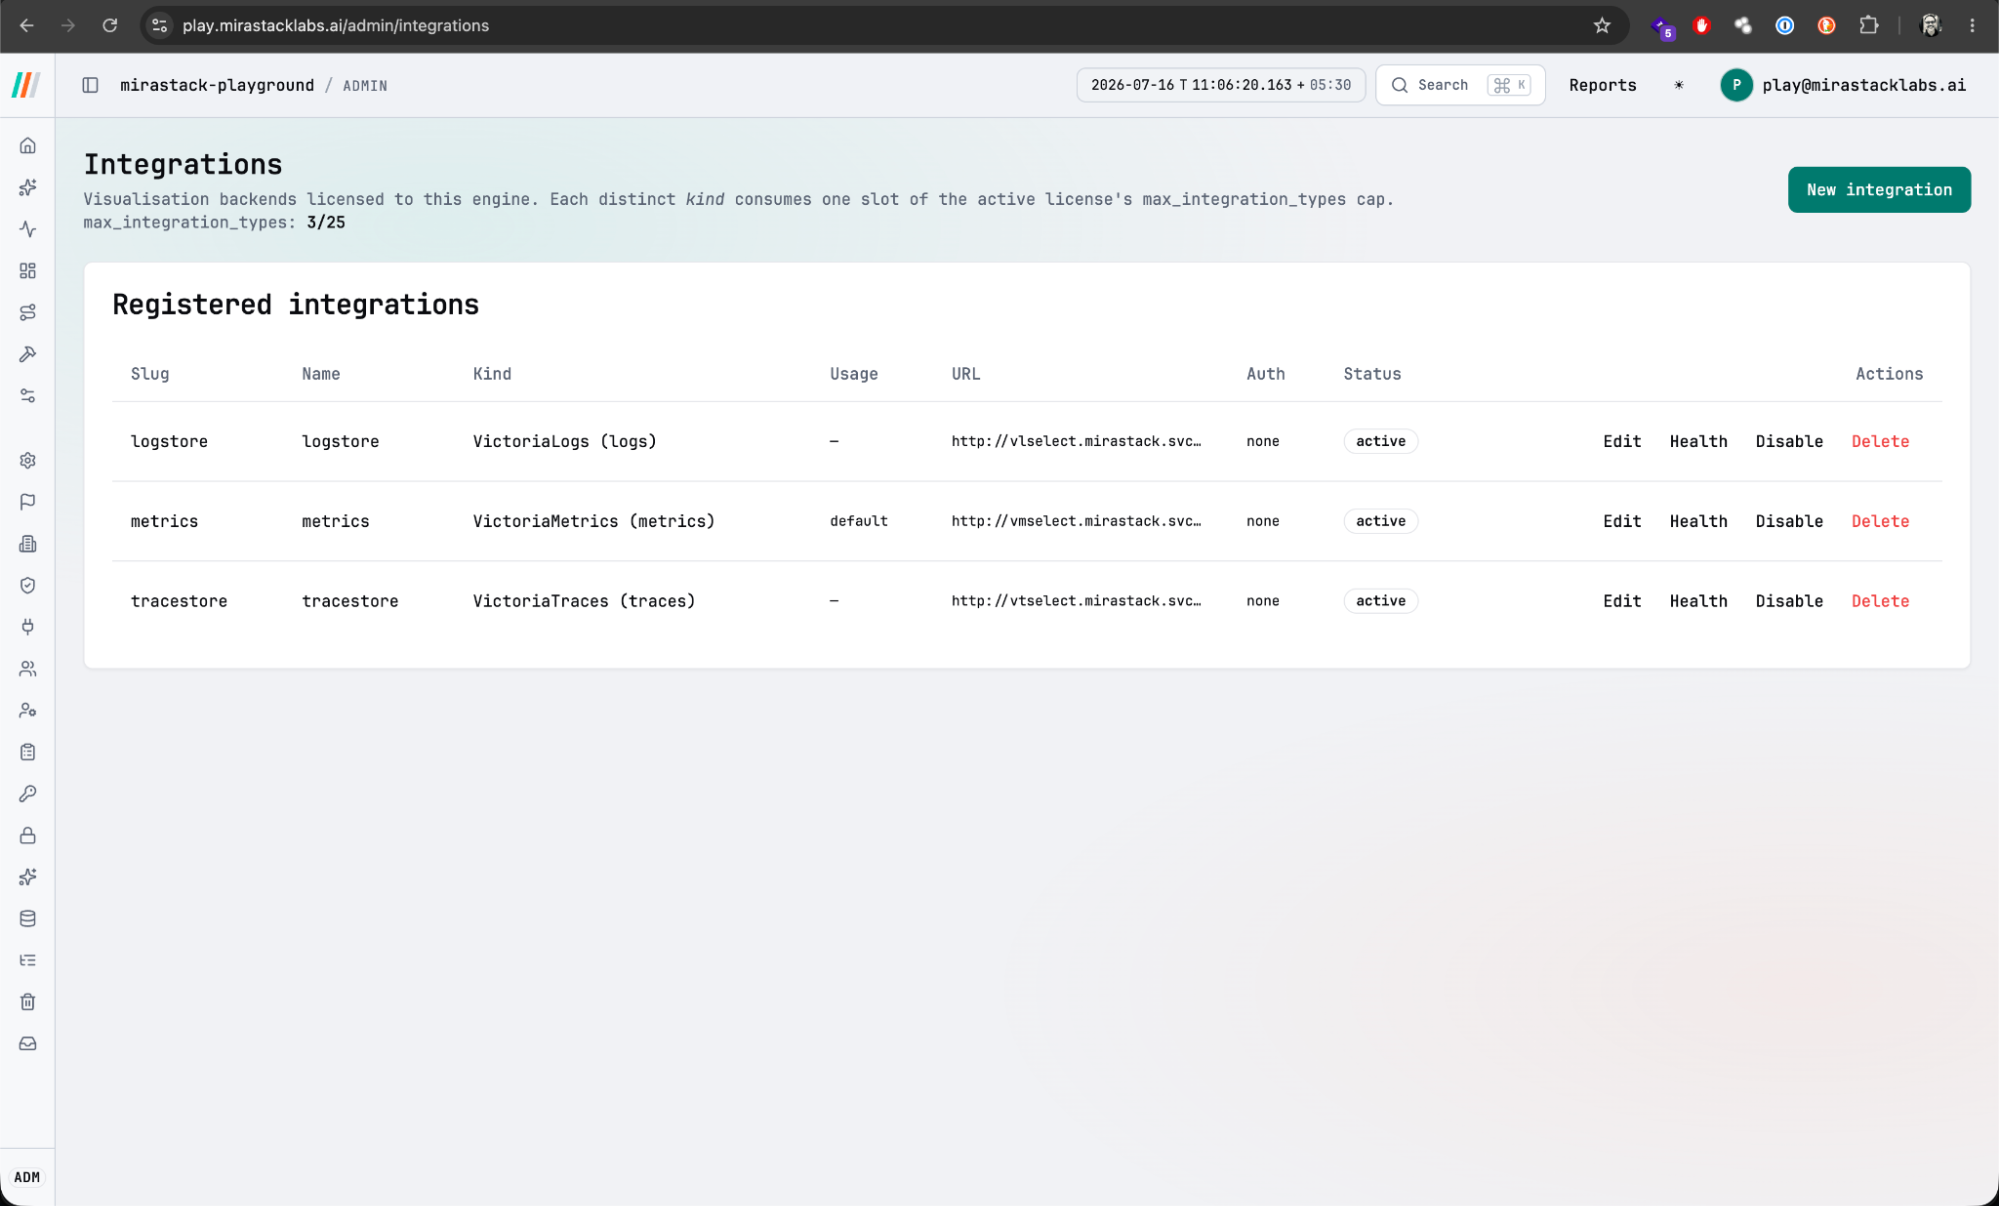
Unified Data Platform: Beyond Technology Observability
MIRASTACK treats data sources as pluggable, first-class concepts. Connect technical and business signals on a single canvas, positioning MIRASTACK as a direct consolidation path for standalone BI tools.
Centrally Governed Integrations
Connect multiple data sources securely under a single administrative model.
- Pluggable support for VictoriaMetrics, VictoriaLogs, VictoriaTraces
- ClickHouse SQL warehouse integration for high-volume business data
- OpenSearch, Elasticsearch, and S3-compatible object storage
- Sealed credentials with AES-256-GCM and SSRF-guarded proxy
Per-Widget Source Binding
Technical and business signals coexist on the same board, in the same visual experience.
- Each widget resolves its own data source and query independently
- Render service latency next to daily active users or revenue
- Sovereign by construction: no data exfil to a vendor cloud
- Absorbs workloads that previously justified separate BI licenses
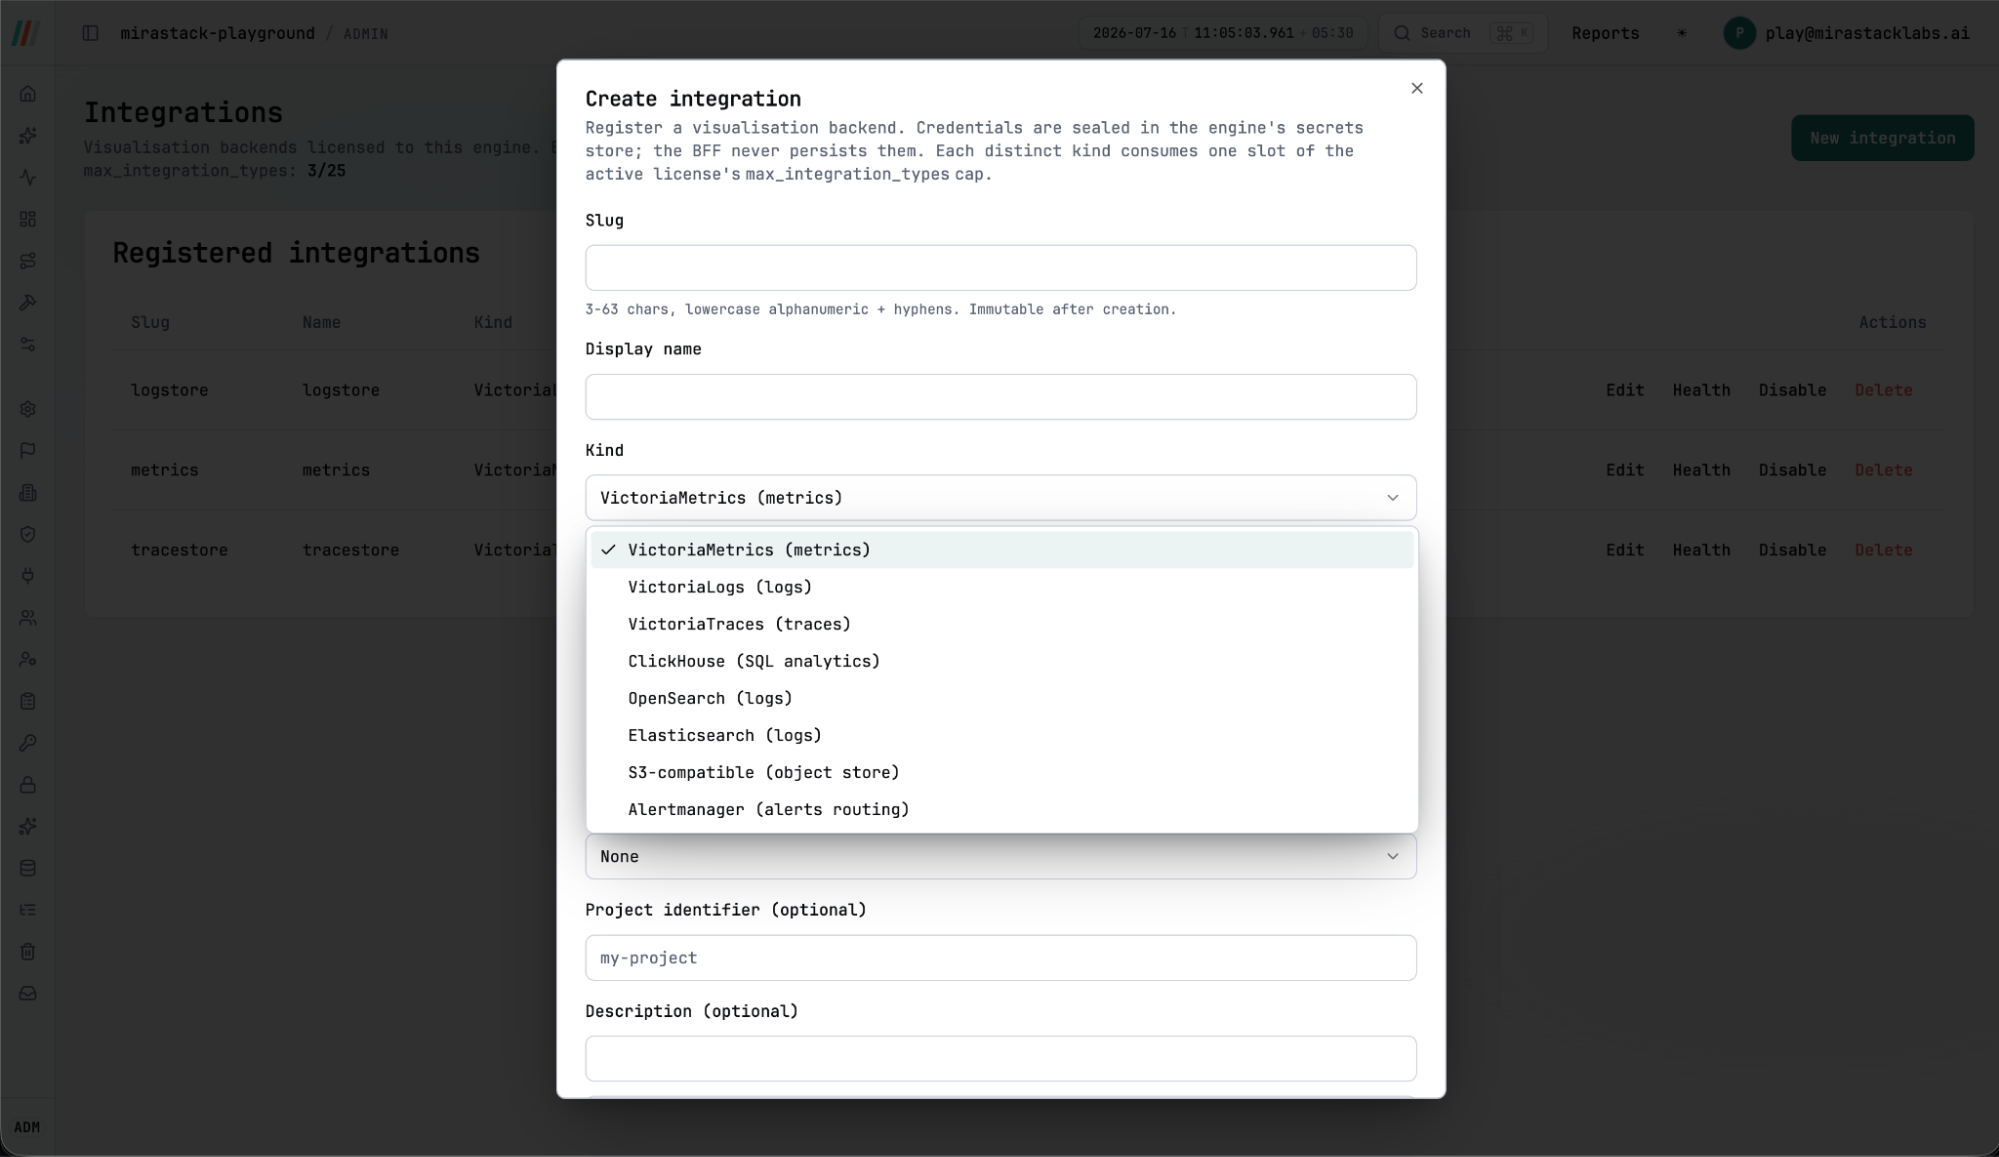
Data Studio: One Pane for Technology and Business Signals
The operator-facing composer that sits upstream of everything visual in MIRASTACK. Designed so that the learning curve is flat: build visuals without first learning a query language.
Three-Pane Workspace
A highly intuitive layout that guides the user from raw data to rich visualization.
- Signal-and-source rail on the left for easy navigation
- Live-preview canvas in the center with debounced rendering
- Configuration rail on the right for styling and thresholds
- Autosaved drafts and guided onboarding tours
No-Code Query Builders
Assemble complex queries for metrics, logs, traces, and SQL without writing code.
- Visual metrics builder: select metric, apply aggregations visually
- Guided log and trace builders covering LogSQL and TraceQL
- ClickHouse SQL builder: select table, columns, and filters visually
- Raw-query tab is always one click away for power users
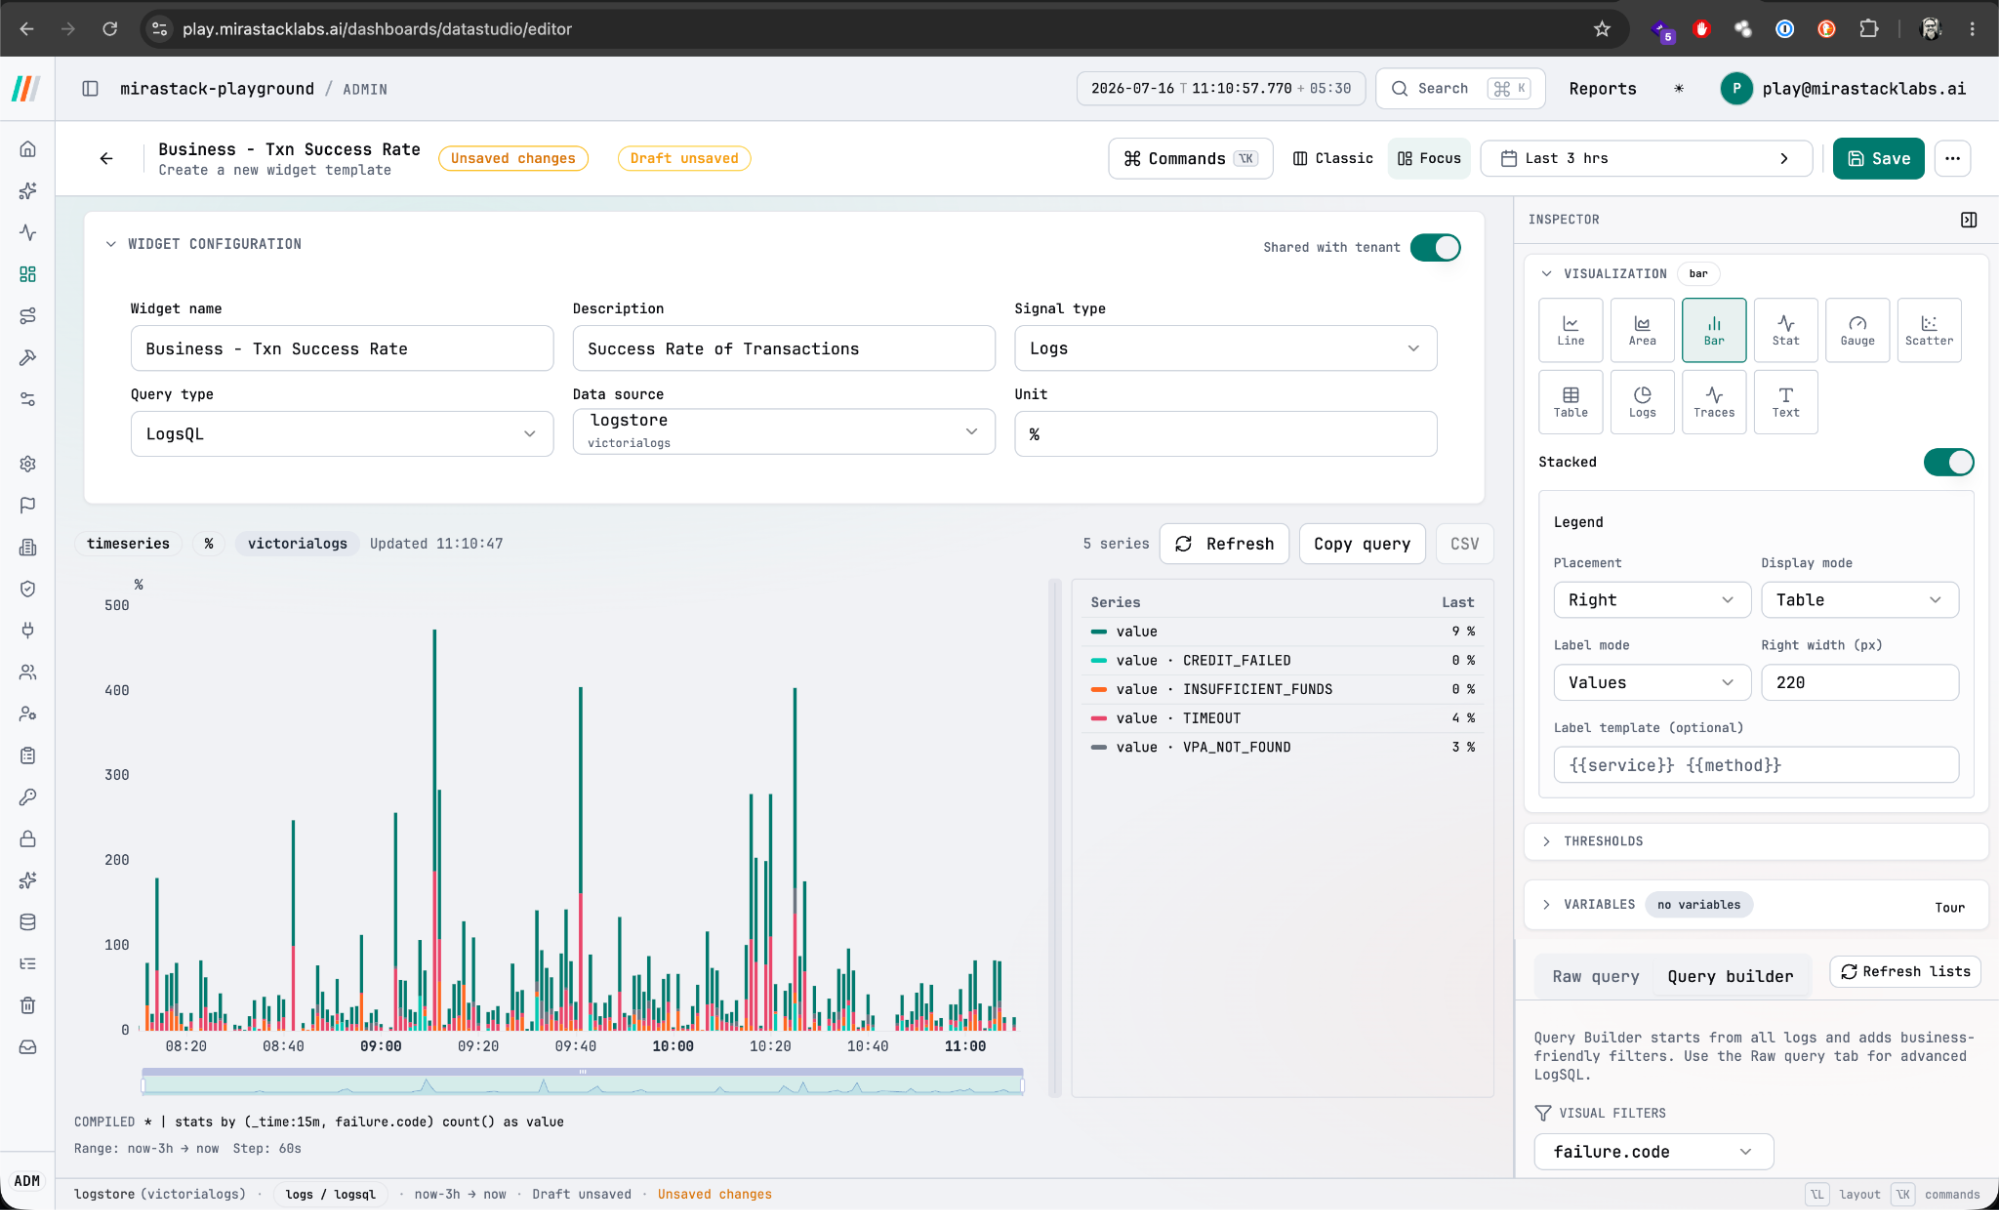
Observe Portal: Your Observability Nerve Center
The comprehensive observability experience built on the three VictoriaStack data stores. It ships with 1,200+ pre-built dashboard widgets, 15+ native integrations, and full parity with legacy observability UIs.
Metrics Exploration
Query PromQL/MetricsQL with syntax highlighting and live autocomplete.
- ECharts-based visualizations with thresholds and confidence bands
- Inline anomaly detection and automatic trend forecasting
- Metrics Explorer screenshot integration
Logs & Traces Exploration
Deep-dive analysis of structured JSON logs and distributed traces.
- Log Explorer with stream filtering, full-text search, and stats
- Trace Explorer with waterfall charts, Gantt charts, and latency breakdowns
- Auto-discovered service dependency graph (Topology View)
Continuous Profiling
Kernel-level eBPF instrumentation for deep system insight without code changes.
- On-CPU and off-CPU profiling, memory allocations, lock contention
- Flame Graphs: top-down and bottom-up call trees
- Java Profiler: JFR (Java Flight Recorder) ingestion and analysis
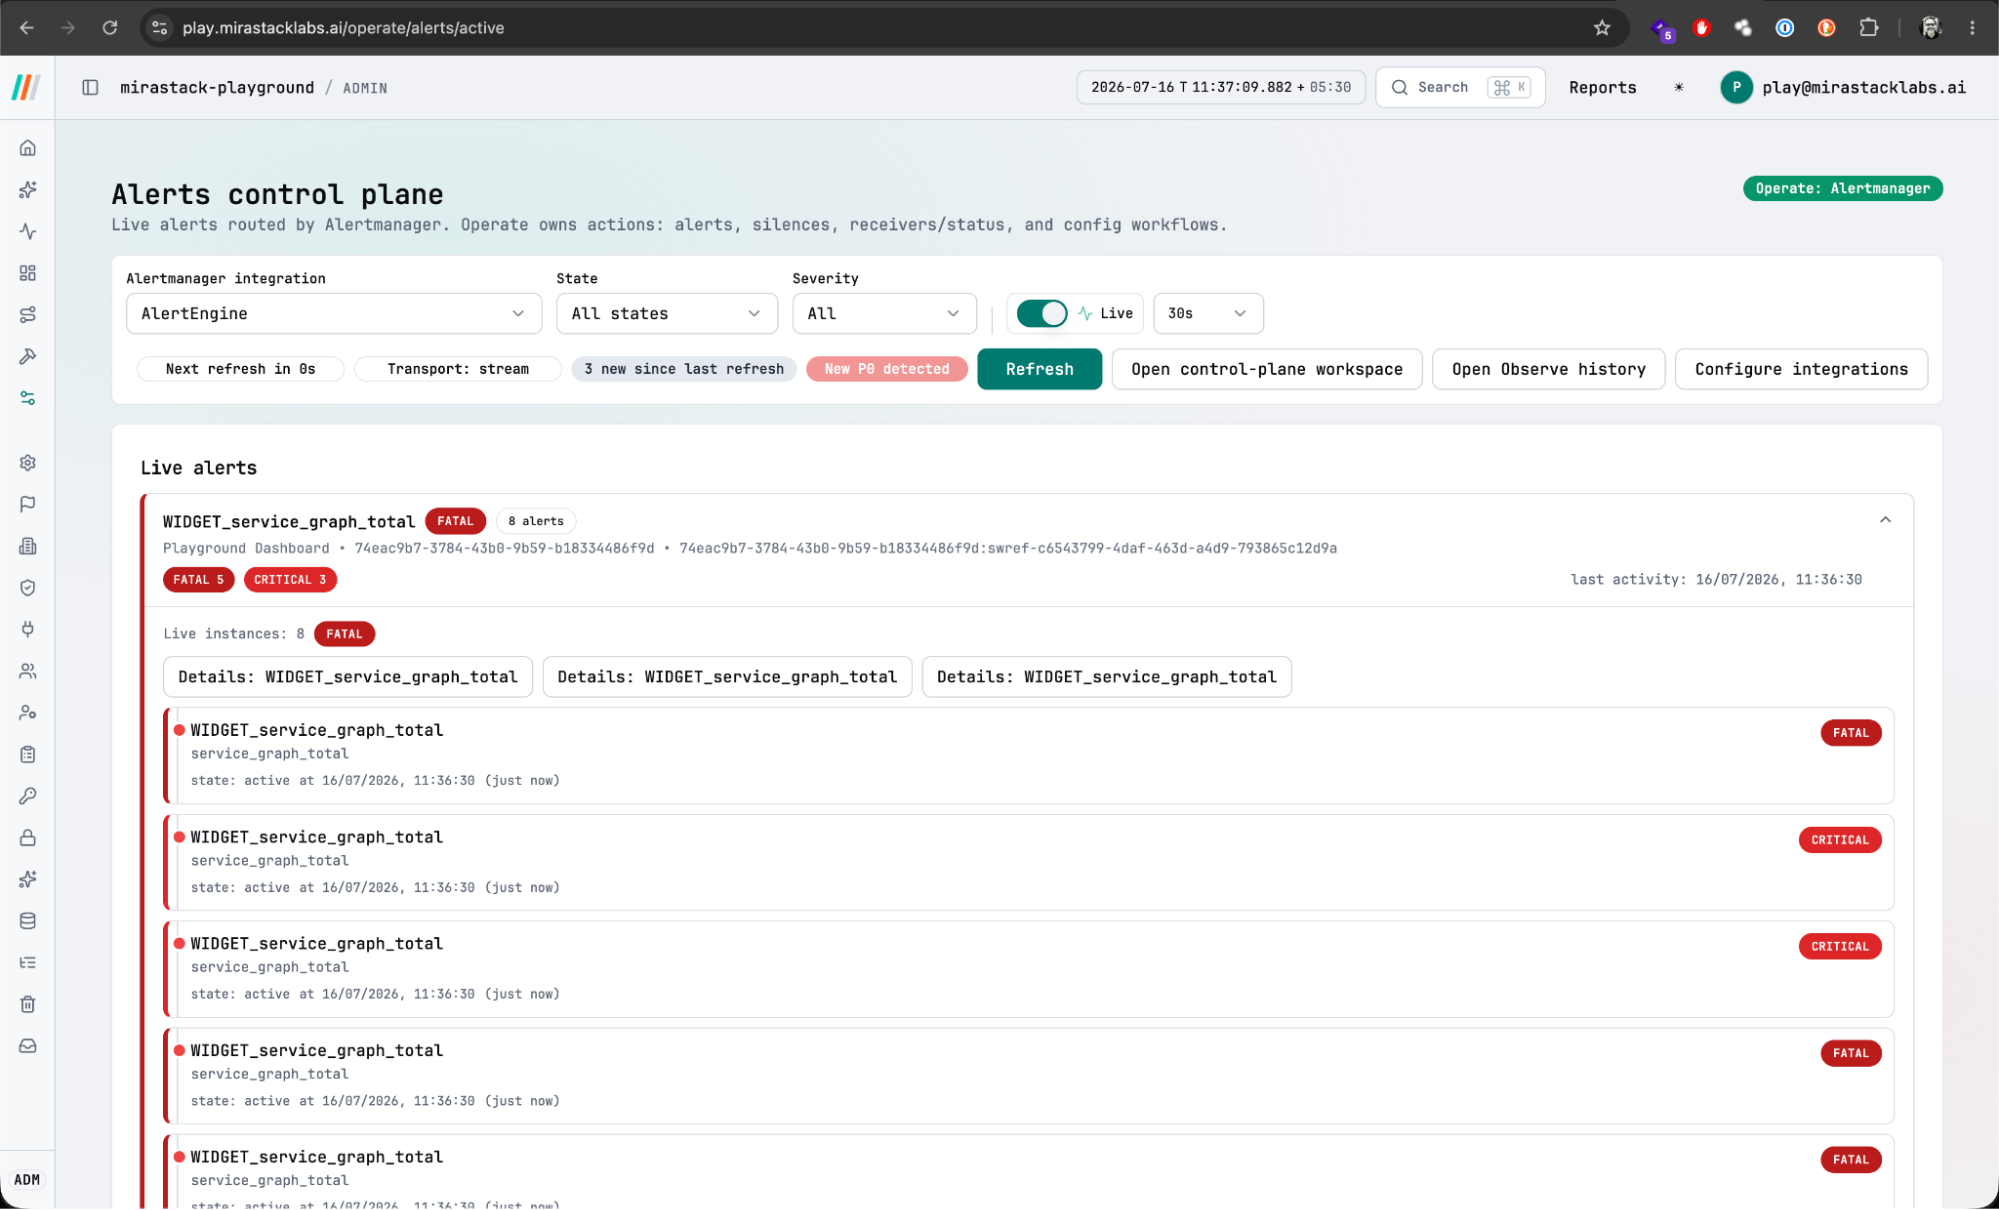
Alerting & Operate Portal
A complete alerting and on-call control plane built on a hardened fork of Prometheus Alertmanager v0.32.x, adding multi-tenancy, secret sealing, and GitOps workflows.
Hardened Alertmanager Fork
Battle-tested routing core with enterprise-grade security extensions.
- Multi-tenancy: each tenant owns its own configuration stored in MariaDB
- Sealed secrets: AES-256-GCM encrypted receiver credentials
- Alert Routing: tree of routes with group-by, group-wait, and repeat-interval
- High Availability: built-in clustering via gossip (HashiCorp memberlist)
Operate Portal Features
The operational control plane for incident response and on-call rotations.
- Live Alert Stream with drill-down, silencing, and acknowledgment
- On-Call Management: escalation policies, schedules, and rotations
- Incident Management: track state (acknowledged, resolved, investigating)
- GitOps: export alert model, templates, and SLOs as version-controlled bundles
Reporting & Open Standards
Enterprises run on artifacts that arrive on a cadence. MIRASTACK treats reporting as a first-class capability and standardizes on open, vendor-neutral protocols.
Headless Reporting Engine
Headless-Chromium rendering producing publication-quality documents.
- Asynchronous queued rendering with pooled background workers
- Outputs: clean, white-background PDFs, HTML, JSON, and CSV
- Scheduling: daily/weekly/monthly presets or full cron expressions
- Automated delivery to email, webhook, and Slack channels
Open Standards Alignment
Protecting your organization from vendor lock-in with open specifications.
- OpenTelemetry: OTLP-native ingestion for metrics, logs, and traces
- Prometheus: 100% PromQL compatibility for queries and dashboards
- Jaeger API: implements Jaeger REST API for trace search
- SBOM Compliance: generates CycloneDX BOMs for security audits
Deployment Options & Sovereign Comparison
MIRASTACK offers flexible deployment topologies designed to meet the most stringent security, compliance, and budget requirements. Whether you run fully air-gapped on-premises or leverage our Sovereign SaaS / BYOC model, your data never leaves your control.
[DEPLOYMENT.MODEL] Bring Your Own Cloud (BYOC) / Sovereign SaaS
While MIRASTACK supports 100% self-hosted and air-gapped deployments, we also offer a unique Sovereign SaaS / BYOC model. In this model, customers get the convenience of a managed SaaS control plane, but all telemetry, databases, and LLM compute remain inside the customer's own cloud perimeter. No data exfiltration, zero egress fees, and absolute compliance.
| Dimension |
MIRASTACKLABS / Platform
|
Standard Legacy SaaS APM |
|---|---|---|
| [DEPLOYMENT] |
Sovereign & Flexible
Fully Self-Hosted (On-Prem / Air-Gapped) or Sovereign SaaS / BYOC (Bring Your Own Cloud). All data and compute stay inside your perimeter. |
Vendor-Hosted SaaS
Cloud-only. Telemetry must be exfiltrated to the vendor's cloud, creating security risks and compliance overhead. |
| [ECONOMICS] |
Fixed Capacity-Based
Predictable licensing based on tenant capacity, integrations, and agents. Decoupled from ingestion volume. Run local LLM (Ollama) for zero-cost AI inference. |
Metered Per-GB Ingest
Variable and punitive pricing based on data volume. Punishes you for instrumenting more systems or retaining logs longer. High exfiltration/egress fees. |
| [SOVEREIGNTY] |
Absolute Sovereignty
You own 100% of your data. It resides entirely on storage you control (VictoriaMetrics, ClickHouse, S3). Zero exfiltration or "phoning home" by the engine. |
Vendor Custody
Data is stored in the vendor's multi-tenant databases. Subject to vendor's security posture, regional outages, and policy changes. |
| [INTELLIGENCE] |
Bring Your Own LLM
Run powerful open-source models (Ollama, vLLM) on-premises or connect to secure commercial APIs. You are never locked into a single AI provider. |
Closed Proprietary AI
Forced to use the vendor's proprietary, closed-source AI models running in their cloud. No visibility into reasoning or data handling. |
| [ORCHESTRATION] |
EGAProtocol Core
Stateless engine orchestrating 7+ specialized agents across Three Execution Lanes (Pre-defined, Autonomous DAG, AI-Improvised). Wire-level 5AG governance prevents runaway loops. |
Static Text Outputs
Limited to basic, single-baseline anomaly alerts and static text summaries. No workflow orchestration, execution lanes, or protocol-level governance. |
| [STANDARDS] |
Standards-First
100% native support for OpenTelemetry (OTLP), PromQL/MetricsQL, and Jaeger. Existing dashboards and collectors work out of the box with zero modifications. |
Proprietary Lock-In
Bespoke query languages and proprietary agents designed to maximize switching costs. Limited or bolt-on support for open standards. |
| [CONSOLIDATION] |
Observability + BI
Collapses the divide between technical telemetry and business analytics. Bind ClickHouse SQL data directly to widgets next to VictoriaMetrics metrics on a single canvas. |
Technology Only
Restricted to technology monitoring (CPU, memory, traces). Requires a separate, expensive BI suite (Tableau, Power BI) and data pipelines to analyze business impact. |
| [EXTENSIBILITY] |
Open SDKs & MCP
Extend the platform with custom agents, LLM providers, and auth connectors using gRPC SDKs. Connect external Model Context Protocol (MCP) servers as engine tools. |
Closed Ecosystem
Restricted to vendor-approved integrations and limited app marketplaces. No support for custom agent orchestration or open protocol bridges. |
| [GOVERNANCE] |
Native UUID5 Isolation
Built-in multi-tenancy with deterministic UUID5 slug-based isolation, per-tenant plugins, and a flexible membership model where users hold different roles per tenant. |
Bolt-On Accounts
Account and team hierarchies bolted onto a fundamentally single-tenant core. Weak isolation guarantees across business units. |
Feature Availability by License Tier
MIRASTACK comes in four license tiers, each unlocking features progressively to match your organization's scale and requirements.
| Feature | Neo (PoV) | Pro (Entry) | Max (Mid) | Ultra (Top) |
|---|---|---|---|---|
| Observe Portal (Metrics/Logs/Traces) | ||||
| Basic Alerting & Service Topology | ||||
| eBPF Continuous Profiling | ||||
| MIRA Chat (Read-Only) | ||||
| Correlation Engine & 5YRCA | ||||
| Early Warning & Prediction | ||||
| Agentic Workflows (Lanes 1/2/3) | ||||
| Custom Dashboards & Marketplace | ||||
| Data Studio (No-Code Composer) | ||||
| Unified Multi-Datasource & SQL BI | ||||
| Scheduled Reports & On-Call/SLO | ||||
| CBOM Scanning & Supply Chain Security | ||||
| Network Discovery & Business Flow Analysis | ||||
| BYO-LLM & Air-Gapped Deployments |